Visual Studio 2010 Beta 1: Parallel Performance Tools Overview
Today, Microsoft’s Developer Division released Visual Studio 2010 Beta 1 for general download. VS2010 is a fully installable release that you can use to preview the great features that we have been working on. I’m especially excited about the beta release of the parallel performance analysis tools that my team has been working hard on. As you'll notice from the screenshots below, our tool has come a long way since my PDC 2008 talk. I believe that we’re giving our developers something special that will make it easier for them to understand many aspects of the behavior of multithreaded applications on Windows.
In my first blog about our Beta 1 release, I’m going to give you an overview of some of the features of our tool. I will follow up with a series of other articles over the next weeks on how the tool may be used to pinpoint issues and address them. Just to be clear, the tool described here is shipping with Visual Studio Team System, so make sure to install that version to get your hands on it!
CPU Utilization / Concurrency Analysis
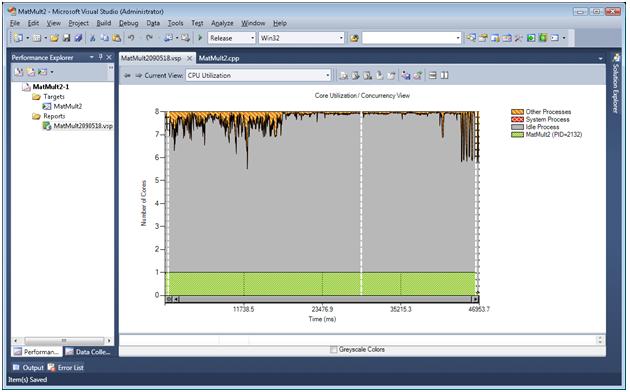
This is the main starting point for our tool. What you will see here is a graph of the number of “logical” cores (remember that physical cores with hyperthreading will appear as multiple logical cores) in the system on which you collected the trace shown on the y-axis and time shown on the x-axis. Your process’ consumption of cores is shown in a green area curve at the bottom of the graph. We also show cores that are free in the grey area, cores that are used by the System process in a red area, and cores that are used by “other” processes that were running on the system when you collected the trace in an orange area. The legend on the right hand side of the graph is a good reminder.
The main purpose of this view is to help the user focus her attention on a period of execution that is of interest. A user might be doing analysis for many reasons, depending on the phase of the development cycle that they are in. For example, someone who is interested in parallelizing an existing application might be interested in CPU-bound regions or periods where there does not seem to be much CPU activity, which could indicate stalls due to I/O. Another user might have parallelized an application, by he is not seeing the speed up that he expected and wants to confirm whether he is seeing the level of concurrency that he expected. Using this view, the user can visually identify this area of interest, zoom in on it by clicking and dragging the mouse, and then switch to the thread blocking analysis view. Here’s a snapshot of the CPU utilization view:

Thread Blocking Analysis
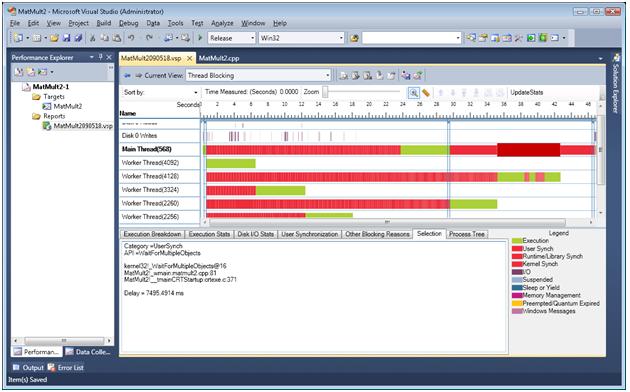
This is the main view of our analysis tool. Its purpose is to analyze the execution of each thread in the process of interest to identify blocking events that may indicate performance bottlenecks. Each blocking event is mapped to a category, such as synchronization, or I/O. The user can then analyze the reason for the blocking event by using interactive callstacks or callstack-based summary reports to understand the root cause of the problem. Because the tool is integrated in the IDE, from the summary reports, the user can also view the source code in their project that may be the root cause of a delay. There are also graphs that summarize where threads were spending their time (e.g., running or blocked), as well as many features to hide/sort threads in order to minimize noise in the reports. In addition to threads, we also show physical disk I/O from the user application or the System process during trace collection. This helps users identify the causes of I/O delays, or even page faults (e.g., loading a DLL, or paging). Further, it is often hard to identify inter-thread dependencies, so we have a special feature that can help identify threads that wait on others and what the latter were doing when they released a blocked thread. This is a great way of identifying work dependencies in your application. Finally, when threads are executing, we provide a way of sampling the execution callstacks. That can be very valuable in correlating the visualization with what code was running at a given period of time. Here’s a snapshot of the thread blocking view:

Core Execution / Thread Migration:
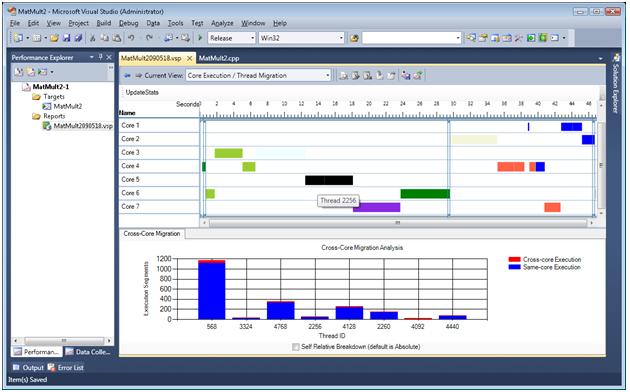
The third view in our tool shows how application threads were scheduled on the logical cores in the system. Using this view, you can identify excessive thread migrations (when a thread is moved to another core as a result of a context switch), that can reduce performance due to caching effects. You can also use this view to understand the impact of thread affinity settings on an execution. Threads are associated with different colors that are displayed in time along the x-axis corresponding to the logical core that they were scheduled on. Once you’ve identified a behavior of interest, you can zoom in on that time segment and switch to the Thread Blocking view for more in depth analysis (e.g., what caused thread blocking events that resulted in thread migration?). Here’s a snapshot of the Core Execution view:
