Using the WPF Visualizer to debug applications in Visual Studio 2010
WPF applications make writing rich client applications much easier but the main drawback is that debugging XAML is difficult. The Visual Studio debugger is very good at debugging imperative languages but when it comes to debugging declarative technologies like XAML, it’s mostly back to "printf" debugging. For example, trying to debug data binding issues or control composition issues in WPF by stepping through code is very hard with the Visual Studio 2008 debugger.
Hence, in Visual Studio 2010, we have introduced a new visualizer to debug WPF applications. In case you are not familiar with a debugger visualizer, it is similar to an add-in that allows the debugger to display data in a more "natural" way. In this case, the WPF visualizer allows you to view the entire state of your WPF application.
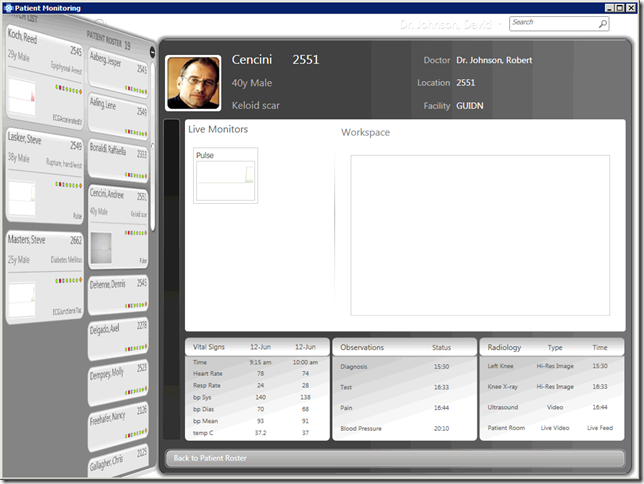
Let’s walk through an example. I have a WPF application (Patient Monitoring) and I’m trying to find out why the patient details for Andrew Cencini aren’t displaying correctly. Here is a screen shot showing the Patient Monitoring application:

In the Visual Studio 2008 debugger, there really is no way to use the debugger to debug this type of problem. In Visual Studio 2010, you can use the WPF visualizer to inspect the details of the entire WPF application. To do that, once you are stopped in the debugger, open Watch or Locals window and click on the magnifying glass next to the WPF control. In this case, I’m using the visualizer on the Flipper3DTransition control.

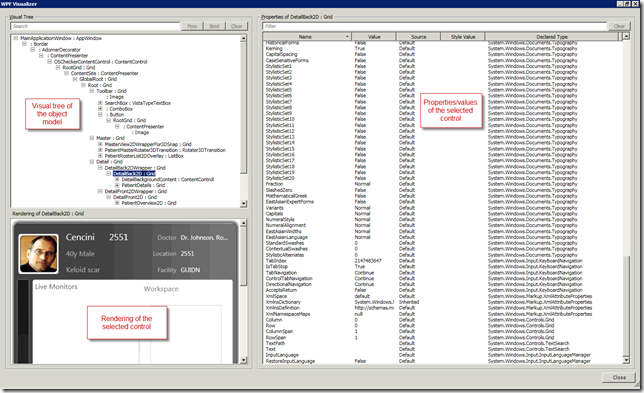
When the WPF visualizer opens, you will see a screen similar to the one below. The WPF visualizer is made up of three panes:
- The Visual Tree pane literally shows you a visual representation of your entire WPF application at runtime! Here, you will see all the WPF controls in your application and how they are composed. You can search for any control using the provided search box at the top of the dialog.
- Right below the "Visual Tree" pane, you will see a rendering of the control that's been selected in the Visual Tree pane. This is a great way to see what your control looks like at runtime
- On the right hand side of the dialog, you will see all the properties for the control selected in the Visual Tree pane. You will also see the values for these properties. There is also a search box that you can use to look for anything in this pane.

Using the WPF visualizer, debugging WPF applications will be a lot easier with Visual Studio 2010. As usual, please leave a comment if you have any feedback.
Habib Heydarian.