Performance Problems in SQL Server - What data should I collect?
If you ever talk to me or any of my colleagues in the SQL Server PSS support team, and you have a suspected SQL Server performance problem, you’ll undoubtedly be asked to run the PSSDIAG tool which usually collects the data that we need. This tool acts as a one stop shop for us to pick up a variety of data sets, including SQL Profiler, Performance Monitor, SQL Server configuration information, SQL Server logs, blocking scripts and many more custom scripts of our choosing. We published a version of the tool for SQL Server 7 and 2000 under https://support.microsoft.com/kb/830232 . Although we still maintain a version for SQL Server 2005, the tool was such a success that it began to be incorporated into the core product itself thereby enabling people to analyze their own performance problems more easily, or collect the data that PSS would need to help them.
Nowadays the public version of the tool is named SQLDIAG and installs by default with all SQL Server 2005 installations. You can read about its options in Books Online https://msdn2.microsoft.com/en-us/library/ms162833.aspx.
It works very simply in default mode, try it now on a test box: simply open a command prompt, switch to this directory
C:\Program Files\Microsoft SQL Server\90\Tools\binn
And run the following:
sqldiag.exe
You’ll see something like the following
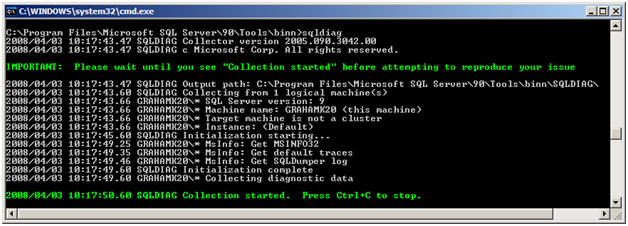
By default it connects to the local machine name, and every SQL 2005 instance it can find. There are many switches and options and a detailed configuration file that can be used to tailor the process (more on this later) but if you’re experiencing a problem and you want to grab some data super quickly without thinking too much, you can just do this. The collector is now writing out data to a sub-directory named sqldiag, and as it says, when you’re ready stop, simply press Ctrl+C. The collector might take a few minutes to shutdown depending upon the speed of your server. When it’s finished, take a look in the sqldiag sub-directory and you’ll see a collection of files. By default you’ll have collected the following:
Default Trace files (if server option enabled)
sqldiag output text file (contains sql error logs, configuration information, internal performance counters , the output from several key DMVs and much more)
msinfo32.txt
sqldumper error log
log and control files for the sqldiag process.
I’ll talk about interpreting this data at another time, but you’ve already collected some interesting data about your SQL Server instance and what it was up to whilst the collector was running.
What you should also notice is that when you ran the tool in this mode for the first time, it unpackaged several .XML files which it uses for configuration purposes. These are as follows:
SQLDiag.XML
SD_Detailed.XML
SD_General.XML
By default if you don’t use the /I switch (to specify an input file) the tool uses the SQLDiag.XML config file and you get the results as above. The true power of SQLDiag in my opinion though is in amending these config files and collecting data sets of your choice. The extra config files automatically created have the following collections turned on:
SD_Detailed.XML
Windows Event Logs
Perfmon
SQL Profiler (including several verbose events such as performance statistics, SQL:BatchStarted and SQL:BatchCompleted)
SD_General.XML
Windows Event Logs
Perfmon
SQL Profiler (with less verbose events)
Within both the perfmon and SQL Profiler events, you have the ability to configure every potential sub event on or off, based upon the situation that you wish to monitor. All you do is edit a copy of the XML file and change individual elements like these from “true” to “false” and vice versa.
 <PerfmonObject name="\MSSQL$%s:Buffer Manager" enabled="true">
<PerfmonCounter name="\*" enabled="true" />
<PerfmonCounter name="\Buffer cache hit ratio" enabled="true" />

<EventType name="Locks">
<Event id="148" name="Deadlock Graph" enabled="true" description="Occurs when an attempt to acquire a lock is ......" />
In many cases though, one of the default templates with contain enough info for you to make an initial assessment of situation. To run sqldiag with one of the other config files (or one you create yourself) use the following syntax:
sqldiag.exe /ISD_General.XML
and you might also want to add a new output directory:
sqldiag.exe /ISD_General.XML /Oc:\sqldiagoutput
One thing that the default configs don’t enable though is the blocking collector, which I do think is particularly useful. To enable this collector you need to create a copy of the SQLDiag.XML and edit the following section:
<BlockingCollector enabled="false" pollinginterval="5" maxfilesize="350"/>
Changing the BlockingCollector enabled value to “true” will turn on the blocking collector, and provide a blocked process report for any blocking experienced whilst the collector is running. This is a particularly common cause of application performance issues and well worth enabling.
In addition to these configurations, one of my colleagues in the US has posted the internal performance statistic T-SQL script which we use to capture all sorts of data from the SQL Server DMVs. This is the principal script that I use every day to troubleshoot performance problems. This script doesn’t install by default with a standard SQL Server setup like the rest of SQLDIAG, but you can obtain the script and download it from the PSS SQL Server Engineers blog here. He also helpfully provided an XML config file with all the required entries to make it run. I found the easiest way to deploy it in a default install of SQL Server was to unzip the 2 SQL scripts and the 2 XML files into the directory where sqldiag.exe lives. You can then simply run the same diagnostics as above, but include these extra T-SQL scripts, by running something like this:
sqldiag /ISQLDiagPerfStats_Trace.XML /Oc:\sqldiag
Although you can also use the cmd files he provided for registering and running SQLDiag as a service. Either way you get 3 extra text files in the output
Over time you’ll find it useful to build up a selection of your own config files, and then you can just copy them to any server you wish to monitor, based upon the situation you want to look at. For example I keep custom ones to hand which focus on the following subjects
Memory Usage
Blocking and general Profiler Trace
Disk Performance
Profiler Trace
Recompilation
Remember though, if you enable a custom configuration file like the ones above, your collections can be extremely verbose. You should therefore consider the following:
1. Disk Space for output: potentially many GBs on heavy loaded machines
2. Disk Drive chosen for output: If you want to monitor disk performance don’t write the output to the same drive, and don’t ever write the output to a network drive
3. Verbose events such as performance statistics can place a heavy CPU load on a server. I only enable these if I’m certain that I need them
Finally you might wish to configure the collector to only run against specific machines or instances, and the following XML elements allow you to do this:
a) Change the machine name element to the name of the server you wish to connect to (the default of “.” means connect to the local machine)
 <Machines>
<Machine name=".">
(Or use the /M switch when running from the command line.)
b) Change the instance name element to the SQL Server instance that you wish to connection to (the default of “*” connects to every instance it can on the machine specified above.
<Instance name="*" windowsauth="true" ssver="9" user="">
I hope this all makes sense. If you have any questions, just post a comment. Over coming posts I'll talk about how to interpret the data you collect.