Silverlight Treemap Control
Microsoft’s Global Product Development – Europe team recently released a Silverlight version of the Treemap visualization for adCenter Analytics. Below we can see it displaying site traffic by user occupation:
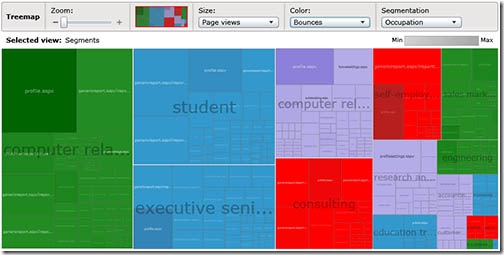
You can read more about it on this blog post, or access it via your adCenter account (go here to sign up).
But, like any good software, this visualization is not tied to one system and can show any form of hierarchical data. Below we see a Treemap representation of the North American National Hockey League teams:
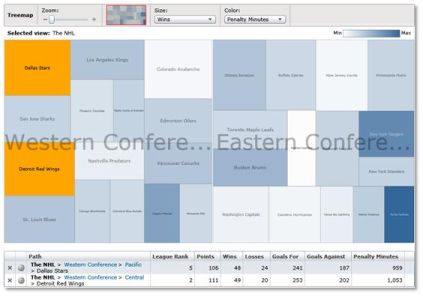
The component consists of two main parts: the Treemap component itself, which visualises the data and the shell, which configures the control, displays information about the cells and even has a ledger at the bottom for keeping note of the information related to the selected cells.
Click HERE to try the Silverlight NHL Treemap. If you don’t have Silverlight installed, you will see a blue icon with the words “Install Microsoft Silverlight”. Click the icon to install Silverlight, it only takes a few seconds and doesn’t require Administrator permissions
Gareth Bradshaw is a Program Manager on Microsoft’s Global Product Development – Europe team in Dublin, Ireland. He holds a BA(Mod.) in computer science and a PhD in computer graphics from Trinity College in Dublin.