Business Intelligence Investigation
The Microsoft Dynamics GP team, are hoping to provide some ideas on how you can use Microsoft
technologies to improve your business intelligence experience with the data
from your Dynamics GP database. To that end, we are creating some example
dashboards that you can use with GP, and looking for feedback from you on your
business intelligence needs.
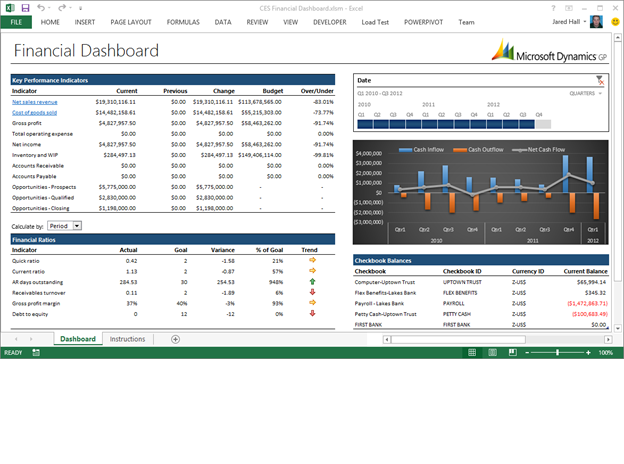
Below is an example of a financial dashboard that can be built in Microsoft Excel,
utilizing some of the new tools available in Office 2013. The dashboard
provides metrics based on live, refreshable data pulled directly from your GP
company database.
Feel free to
download the dashboard to use for reporting on your data using the link below.
You just need to walk through a few steps to hook up the data connections from
the sheet with your data.
Note: Some
of the functionality on the dashboard requires Office 2013, which doesn’t yet
have an announced release date. However, you can download the Office 2013
Preview to try it out at the following site:
https://www.microsoft.com/office/preview/en
This
dashboard is intended as an example to help individuals see how Excel
functionality can be used to build reporting experiences. But we’re also hoping
to build out a few more in the future. So we want to get feedback from you on
your reporting needs. Here are some questions to help get the conversation
rolling. Please jump in the conversation in the comments section below:
1.
What changes would you make to the financial
dashboard to make it more useful for your role?
2.
What other dashboards or reports do you need for
your role, and what information would you want displayed on that dashboard?
3.
What is your role? In your role, what are the
most common questions you need answers to? What information do you need or use
to answer those questions?