Getting more out of Excel Reports
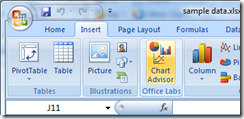
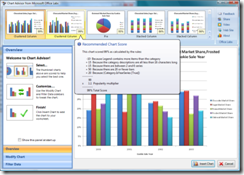
Microsoft Dynamics GP V10 delivered 200 out of the box Excel Reports that allow you to quickly generate, modify and save refreshable excel files. The beauty of this is the ability to create pivot tables and graphs quickly off of Dynamics GP information that is easily refreshable from inside Excel. Now . . . I’m no graphing guru and I suspect there are many out there that are in the same boat (no Fargo flood pun intended). Sooooo here’s a great Office Excel 2007 add-in that suggests different kinds of charts according to the data that is selected.
https://www.officelabs.com/projects/chartadvisor/Pages/default.aspx
Based on the data in your spreadsheet, it identifies, ranks, and displays an array of charts most relevant to you so you can make the most out of your information.
Have fun with it.
Errol

