Dissecting the Visual Studio Load Test Results Database (Part 5– The Slicing of Data)
In my last post of this series, I provided some views that set us up to start getting more meaningful information out of the results DB. In this post, I will start showing you some of the stored procedures I use to slice the data. But first, I need to let you know that some of my stored procedures do require you to have “All Individual Details” stored in the database for the runs you want to examine. Others do not. I will make a note for each sproc as to the requirements for that sproc.
A Note About this Particular Series of Posts
I am starting off fairly simple with the sprocs I am showing here. However, I am leading up to some fairly complex calculations as well as data warehousing. I will be showing you new tables I add to the DB soon that help with a number of calculations, but since they rely on much of the same code as the simple ones, I want to explain these first.
The start of every report
We always need to use the LoadTestRunId to define what run(s) we want to work on. To get that, we use a simple query:
SELECT LoadTestRunId, LoadTestName, Description, StartTime, Outcome FROM LoadTestRun
For the rest of this post, we will use either run #4 or run #52
Page Response Times
The first sproc is VSLT_prc_Page_ResponseTimes. There are also similar sprocs for tests and transactions. There are 5 parameters you can pass in, but only one is required (the LoadTestRunId). If you do not supply any of the others, they will use default values:
@RunId INT
,@StartOffset INT = NULL
,@EndOffset INT = NULL
,@NameFilter nvarchar(255) = '%'
,@NumberOfRows INT = 25
To show the basic syntax, here is the call and results for an entire run, in this case run #4:
EXEC VSLT_prc_Page_ResponseTimes
@RunId = 4
Now, let’s look at the graph of the user load for the run (image below). Here we can see that the load steps up throughout the run [the highlighted red line], so looking at an overall average is misleading. We want to be able to look at the values during each constant load portion. I chose the portion between 2 minutes 10 seconds and 4 minutes.
To get the values there, I add two more of the parameters to the call to the sproc, and it now calculates the values using only the page responses that were received during the time frame specified. NOTE: The offsets are specified using seconds and are based off of time from the start of the run, so 2 minutes 10 seconds = 130
EXEC VSLT_prc_Page_ResponseTimes
@RunId = 4,
@StartOffset = 130,
@EndOffset = 240
And here are the results [NOTE: The last two columns; Scenario and TestName both use one of the VSLT Views to get the proper names to add here]:
The Way It Works
The heart of the sproc is the WHERE clause filter. The rest of the sproc is all of the joins and the temp tables to allow for multiple queries to be combined (this is required in order to get the 90% and 95% values). Let’s break it down and then you can modify it however you want if you need different results.
WHERE
a.LoadTestRunId = @RunId
Pick only this run
AND (@StartOffset IS NULL OR c.EndTime >= DATEADD(second, @StartOffset, b.StartTime))
If no start offset was provided, ignore this part of the filter. If it was provided, then filter results to only those which have an end time greater than or equal to the time of the specified offset.
AND (@EndOffset IS NULL OR c.EndTime < DATEADD(second, @EndOffset, b.StartTime))
If no end offset was provided, ignore this part of the filter. If it was provided, then filter results to only those which have an end time less than the time of the specified offset.
AND d.RequestUri LIKE @NameFilter
I cheat here and provide a global value for the name filter, which makes the query slower since it has to scan the entire table, but it simplifies the use of the query. I will probably update this in a future version.
AND (c.Outcome = 0)
This filter is hardcoded to only look at requests whose outcome was PASS.
AND (a.InMeasurementInterval = 1)
This filter is hardcoded to exclude any requests that were captured during warmup or cooldown.
Page Throughput
This sproc is the same as the Page Response Time except that it focuses on calculating the number of pages per second for each page. It takes the total number of pages executed in a specified interval and uses the interval’s duration to get the final value. As with the response time sproc, it takes between 1 and 5 args (the same five). Here is the output for the throughput sproc for the same run as above and the same interval time:
EXEC VSLT_prc_Page_Throughput
@RunId = 4,
@StartOffset = 130,
@EndOffset = 240
I could have combined the throughput calculation with the response time sproc, but you will see later on when I get into multiple runs and other parts that it is easier to keep these separate. However, since you are getting access to the code, feel free to handle it however you would like.
Grouping By Name
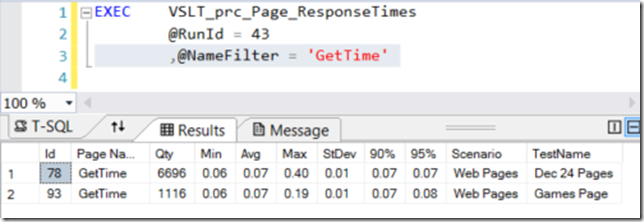
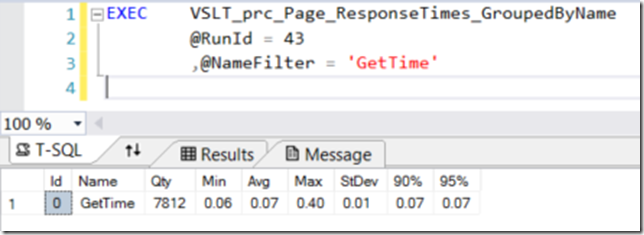
The last part I want to show here is calculating the response times grouped by their name. Sometimes you may have multiple web tests or scenarios that contain calls to the same page. As I explained in an earlier post, Visual Studio tracks each of these separately. However, you can use this sproc to get the response times by using the request URL or reporting name as the grouping mechanism. Take a look at the two tables below. The first shows the response times for a test I ran that had a timer call in two different locations. The second shows the same test results, but with both instances of the call combined and recalculated:
Conclusion
Hopefully you will start to see how you can use the data in the Database to make more informed evaluations of the results. As we delve into the next part, I will setup some tables that can be used to build quick dashboards and also to allow for more automation of much of the interval calculations shown in this post. As always, please provide feedback.
The sql file attached contains the following stored procedures:
- VSLT_prc_Page_ResponseTimes
- VSLT_prc_Page_Throughput
- VSLT_prc_Page_ResponseTimes_GroupedByName
- VSLT_prc_Test_ResponseTimes
- VSLT_prc_Transaction_ResponseTimes
- VSLT_prc_Transaction_ResponseTimes_GroupedByName


