All About Load Test Planning (Part 5-Load Profile Additional Considerations)
In the previous post, I showed you how to come up with the profiles to use in a test as well as the numbers to plug into the profile. I also showed two fairly simple examples of load profiles that you might generate. In this post, I will show you some more examples of profiles, as well as some of the gotchas from these profiles. All of these are taken from real engagements I have performed, although the data and information is completely sanitized.
Example 1: Too Many Use Cases
This customer had defined eight different use cases to use for the load profile, but they provided FIVE sets of numbers to use for the loads on each use case. The five different sets of numbers represented five different business cycles in their industry and they felt that it was important to see if the system could handle the load expected in each of the cyclers:
| Use Case | Profile 1 | Profile 2 | Profile 3 | Profile 4 | Profile 5 |
| Read Only | 100 | 30 | 50 | 50 | 50 |
| Active | 0 | 0 | 20 | 20 | 20 |
| Generate | 120 | 50 | 60 | 60 | 60 |
| Regenerate | 0 | 150 | 20 | 20 | 20 |
| Sign Off | 0 | 0 | 50 | 200 | 50 |
| Archive | 0 | 0 | 25 | 100 | 300 |
| Modify | 2000 | 5000 | 4000 | 2000 | 2000 |
| No Change | 2000 | 1500 | 4000 | 2000 | 2000 |
As we looked at the table, and we started adding up all of the different load tests we would need to execute, we realized that we would not have enough time to complete every one of the desired tests. When I looked at the numbers, I noticed that there wasn’t too much difference between the load in Profile 3 and other profiles except for the last two use cases. I suggested that we build a new profile that used the highest count from each use case and run that. If it passed our criteria, then we knew that all of the individual profiles would pass. We could do this because we were testing specifically to see “If the System can handle the expected peak load.” Below was our final profile. The system could handle this load, so we could easily assume that the system could handle any of the loads specified in the profiles above.
| Use Case | Final Profile |
| Read Only | 100 |
| Active | 20 |
| Generate | 120 |
| Regenerate | 150 |
| Sign Off | 200 |
| Archive | 300 |
| Modify | 5000 |
| No Change | 4000 |
Example 2: Too Fast
I was brought into an engagement that was already in progress to help a customer who was trying to figure out why the system was so slow when we pushed the load to the “expected daily amount.” The system was taking as long as 120 seconds for some requests to respond and the maximum allowed time was 60 seconds. They said that they were used to seeing faster times when the system was not under load. I started asking them about the load profile and I learned two things that they had not done properly.
- They were using the wrong type of load pattern to drive load. They had chosen to use the “Based on number of tests” pattern when they should be using the “based on user pace” pattern. By selecting the Based on number of tests, they were pushing the load harder than they should have (explanation below)
- They were using the wrong numbers for the amount of work that an actual user would be expected to perform.
Because of these two items, the work load they were driving was about 6 times higher than expected peak load. No wonder the system was being slow. I showed them how to rework the numbers and we switched the test profile to user pace. When we ran the tests again, the system behaved exactly as it should.
Comparing “Number of Tests” to “User Pace”
The reason that using the “Based on the number of tests” (or “based on the number of virtual users” is NOT good when trying to drive a specific load is that Visual Studio will not throttle the speed of the tests. When a test iteration is completed in either of these modes, Visual Studio will wait for the amount of time defined by the “think time between test iterations” setting and then execute the next test it is assigned.. Now, if you assume that you know how long a given iteration of a test should take and you use that number to work backwards to a proper pace, you still may not get the right load. Consider this:
- A given web test takes 2 minutes to complete.
- You want to have that web test execute 12,000 times in an hour.
- If you work it backwards, you would see that you could set the test to use 1,000 vUsers and set a “think time between test iterations” of 3 minutes.
This will give you the user pace you want….. Until you fire up those 1,000 users and realize one of two things that could cause the pace to be wrong:
- the load slows down the test so that it takes 3 minutes. Now your pace is not 12,000/hour, but 10,000/hour.
- the test is being run on a faster system (or something else causes the test to run faster, including performance tuning) and the time for an iteration is 1 minute. Your pace is now 15,000/hour.
If you set the model to “Based on User Pace” Visual Studio will ignore the “think time between test iterations” setting and will create the pacing on the fly. In this case, you set 1,000 vUsers and tell each one to do 12 iterations/hour. Visual Studio will target a total time of 5 minutes for each iteration, including the think time. If the iteration finished in less than five minutes, it will wait the right amount of time. If the iteration takes longer than 5 minutes Visual Studio will throw a warning and run the next iteration with no think time between iterations.
Example 3: Need to use multiple scenarios
Sometimes when you look at the rate that one test needs to execute compared to another test, you may find that you cannot have both tests in the same scenario. For instance if you have one test that needs to run once/hour and another that needs to run 120/hour, but the 120/hour takes 2 minutes to complete. You can no longer run that test with a single user . So you decide to decrease the rate to 30/user/hour and then increase the total number of users to 4. Now, the other test is running at four times the rate. For situations like this, I simply move the tests into two separate scenarios.
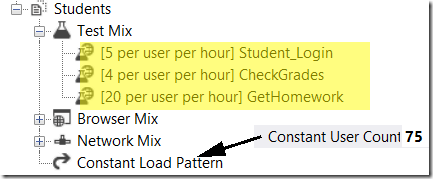
You may also find that you have too many tests in a scenario that has “Based on User Pace” to allow a user to complete them all. When you specify the User Pace model, Visual Studio will expect that a single vUser will execute EVERY test in the scenario at the pace defined. Let’s go back to the school test from the previous post. If you look at the scenario for Students, you will see that there are 75 vUsers. Each vUser will have to complete 29 test iterations in an hour to stay on track. Visual Studio does not create separate users for each webtest. Therefore you need to make sure that there is enough time for all of the tests to complete. If not, split them up into separate scenarios.
Example 4: Don’t Count It Twice
This one bites a lot of people. Let’s say I am testing my ecommerce site and I need to drive load as follows:
| Use Case | Qty to execute |
| Browse Site | 10,000 |
| Add To Cart | 3,000 |
| Checkout | 2,000 |
So you create your three tests and set the pacing up for each. However, you need to remember that *usually* in order to checkout, you have to already have something in the cart, and to add something to the cart, you have to have browsed. If you use the quantities above, you will end up with 15,000 browse requests to the site and 5,000 Add to Cart.
Bottom Line, if a test you execute contains requests that fulfill more than one of your target load numbers, account for that in the final mix.
Example 5: Multiple Acceptance Criteria for the Same Item
This is in response to a comment left on my previous post about Scenarios and Use Cases. In this situation, I may have a requirement for the response time for generating a report. Let’s assume that the requirements are:
- Generation of the report must be < 2 seconds for <500 rows
- Generation of the report must be < 7 seconds for <10,000 rows
First, I would need to get more info from the business partners.
- Is the user type the primary reason for the big size difference? (a sales clerk checks the sales he/she has performed today vs. a store manager checking all of the sales by the entire staff?).
- I would add a new use case to the manager scenario and a separate use case in the sales scenario of the test plan and move forward as normal.
- Is a parameter passed in, or the query being executed the primary reason (same as the first example, but the same person runs both reports)
- I would ask the business partner what the likelihood of either happening is and then I would devise a set of data to feed into the test that would return results close to each number. I would probably then create two different web tests, one for each query set and give them names that indicate the relative size of the response. Then I could easily see how long each one took.
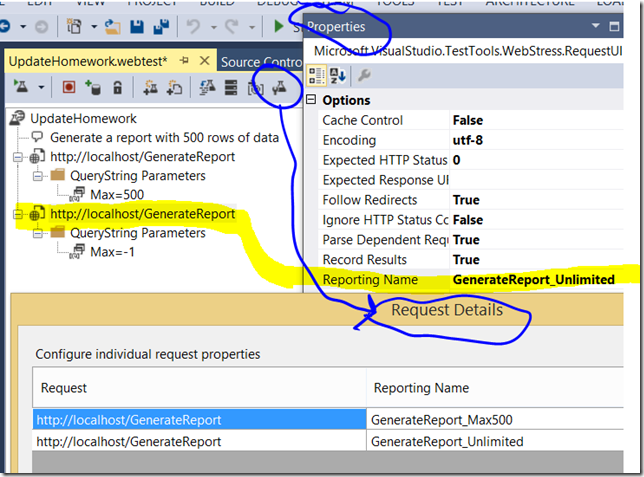
It is also worth noting that you can have the same request show up multiple times in a webtest and change the way it gets reported by using the “Reporting Name” property on the request to display the relative size:
Example 6: To Think or not To Think
I covered this topic in a separate post, but I am adding a pointer to it here because it applies directly to this topic, and if you have not read my other post, you should. The post (“To Think or not to Think”) is here.
Example 7: Step Loads that do not ramp
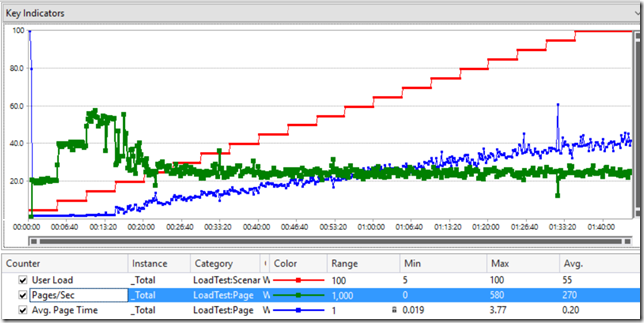
I have talked a lot about using step loads to understand the behavior of an application at various different amounts of load. I have even built some reporting artifacts to help get and analyze results for this stuff. However, I still see a lot of customers drive step load profiles using scenarios that do not allow for those profiles to work properly. Take the following graph from a load test:
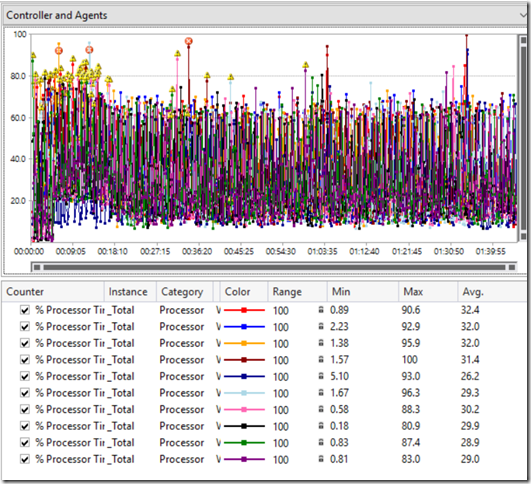
This test has a step profile going from 5 to 100 vusers with 5 users per step. The first three steps do show a “proper” behavior of throughput (pages/sec) increasing as the user load increases. However, it then reaches a plateau and then starts to fall back down to almost the original throughput. Essentially, something in the testing environment is saturated and cannot keep up. You see the same indicator in the response time, where it is somewhat consistent for the first three steps and then starts to increase every step, even though the throughput is staying constant. The other thing I noticed was that the agent machines were in trouble from the beginning:
This behavior tells me that the most likely issue with throughput is going to be that some part of the test environment other than the application (probably the test rig) is the weak link. There are a number of possible issues/resolutions, and the purpose of this part of the post is NOT to show how to determine the cause for the failed ramping, but to know to look for the signs of failed ramping and make sure that the test harness and test rig stand a chance of succeeding when doing this type of testing.


