A Novice guide to Application Insights !
The below article shows some cool features of App Insights!
App Insight is a telemetry tool which can be made use of qualitative analysis and sometimes helps in prediction too for a business.
Topics Covered
- Deploying a web application to cloud and add app insights
- Telemetry analysis of the hosted web application.
Tools used: VS2015, Azure Subscription.
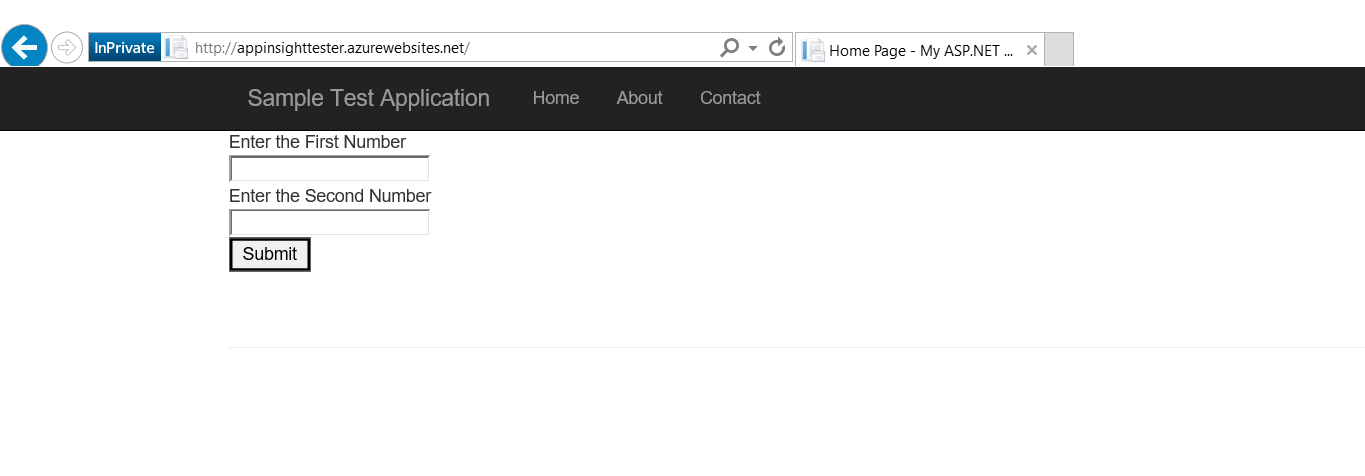
How to deploy a web application to cloud and add app insights.
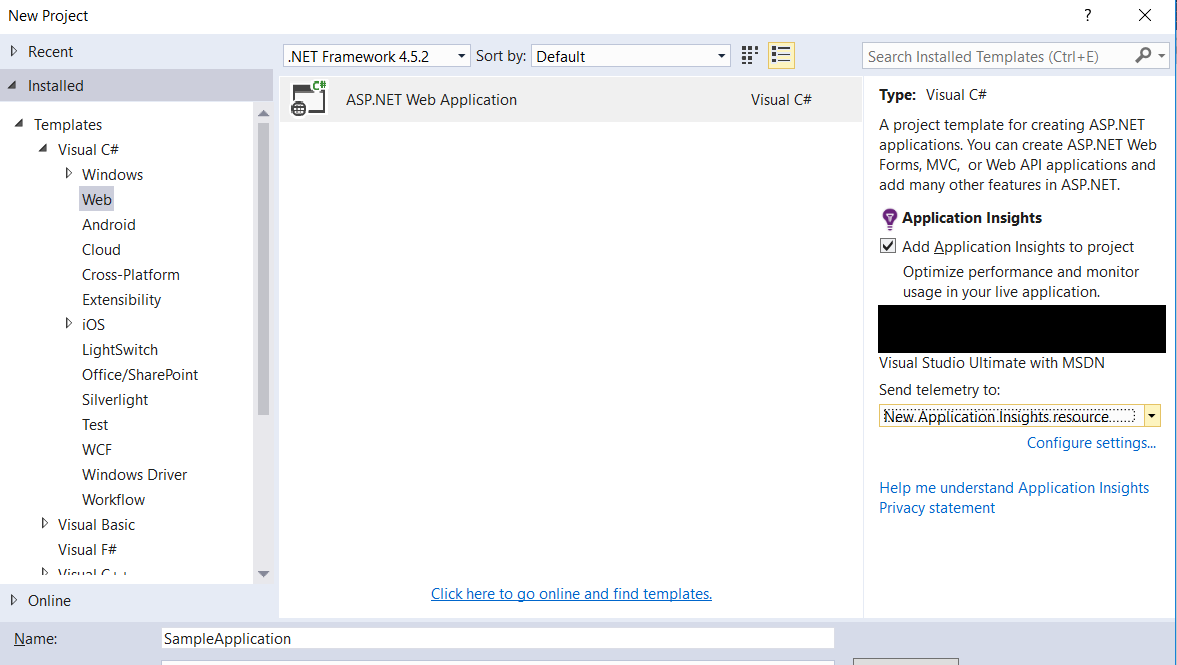
Launch Visual Studio 2015 and create a new project.
Choose web application from the default template and select the checkbox ‘Add application insights to project…’. Another option is to select ‘Send telemetry to’ either a new application insights or an existing one. User can able to Configure the application insight for the resource already available in the cloud.
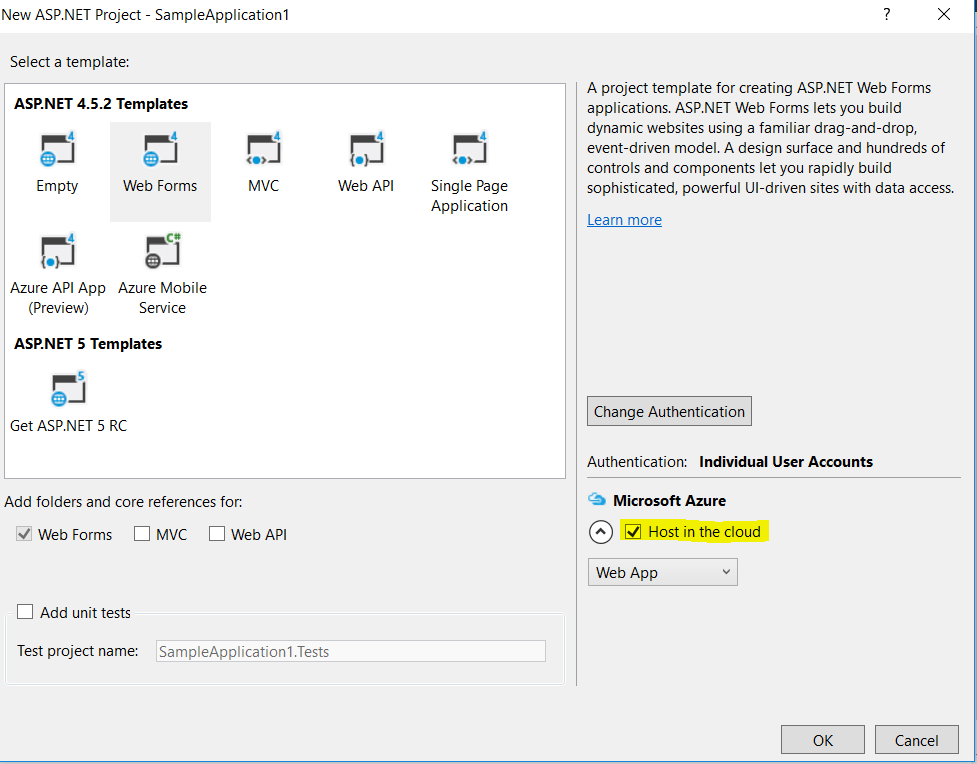
Choose a asp.net template and select host in cloud. Click OK
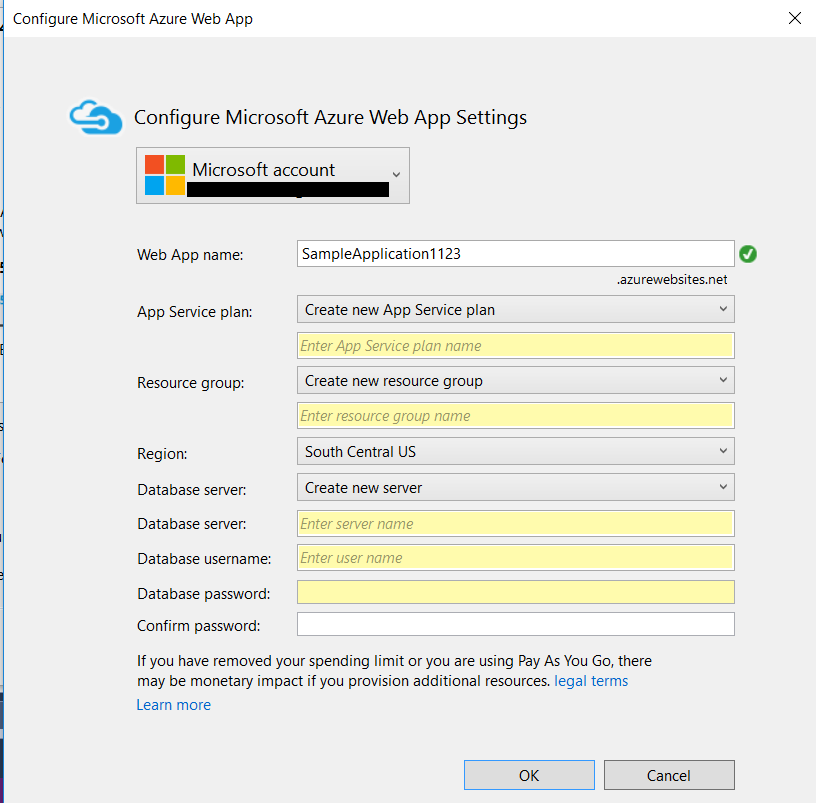
You get a pop up to select webapp name, app service plan, resource group, region, database(optional). Click ok.
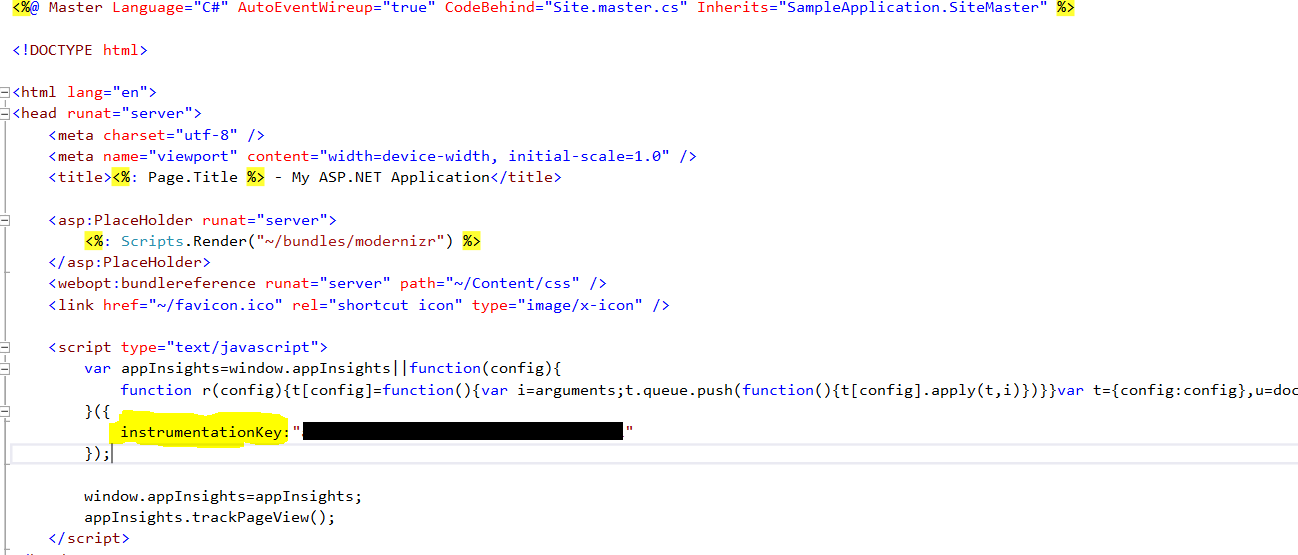
One can verify the addition of app insights instruments key in master.cs page as shown below.
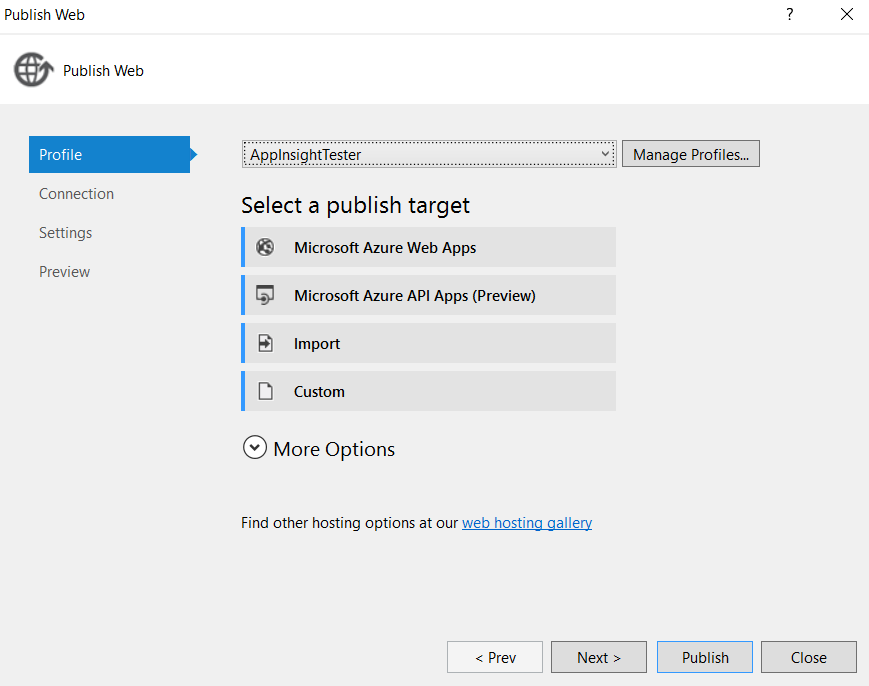
Once the website is functional, right click on the web solution and select publish. Here already there is a profile created. You can click manage profile and add a new profile.
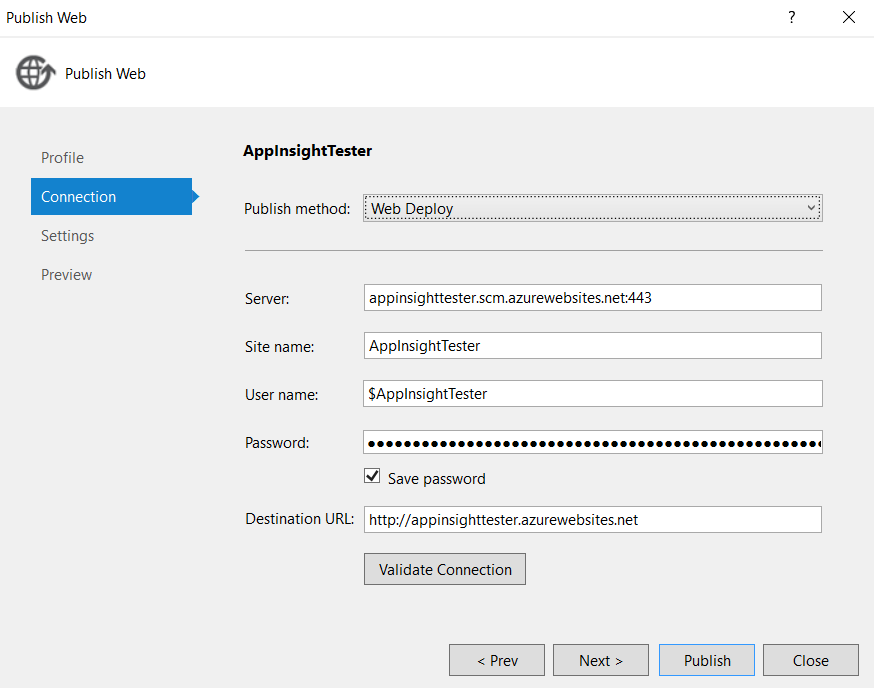
In the connection dialog below. All the values will be populated. You can change the designated URL.
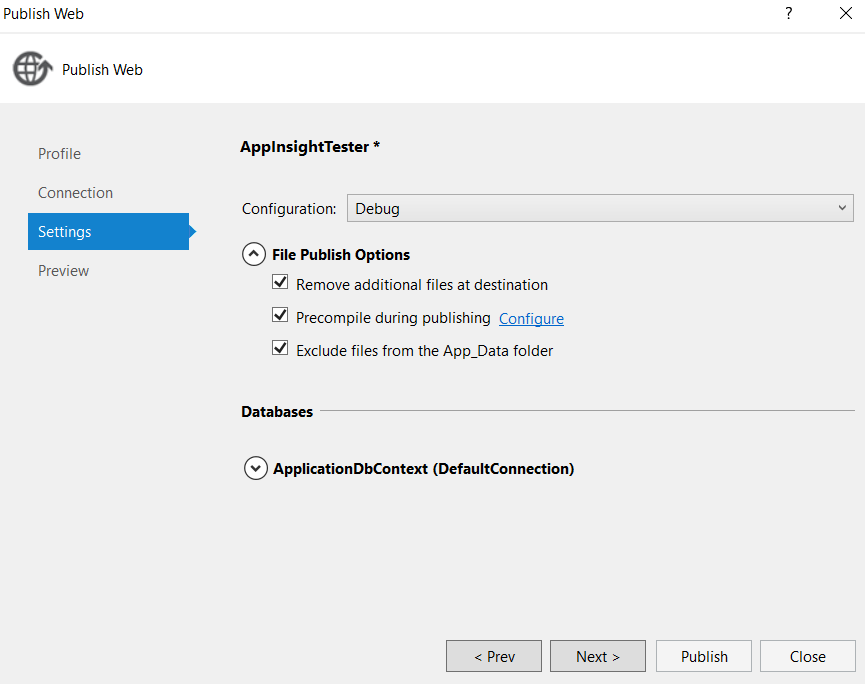
Under settings, based on application preference, debug configuration is chosen.
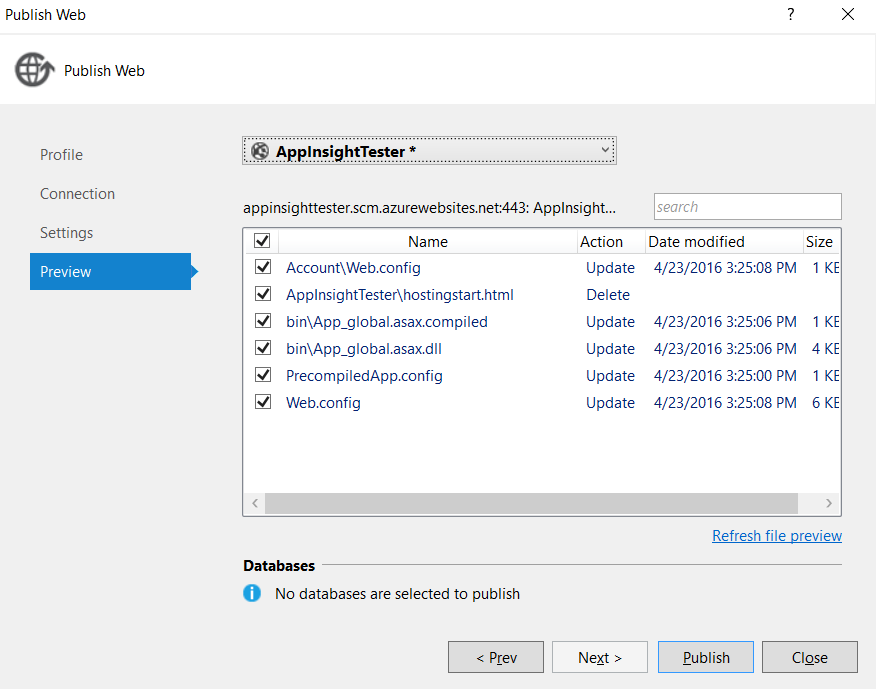
In the preview dialog, user can view the files to be uploaded. And select publish.
Finally, the site is hosted in azure cloud.
Telemetry analysis of the hosted web application
Once the application is added with app insights and hosted in azure. Goto https://portal.azure.com and login with the subscription ID.
Under application insights, the added value will be visible.

| Feature of Application insights | Parameters | Description | Sub parameters | Comments | Sample |
| Home Screen | Settings | Audit Logs | Landing Page | User can view the log history as a chart or without a chart | |
| Export | User can archive audit logs to a storage account or to an azure event hub | ||||
| New Support Request | User can create a technical support request here | ||||
| Application Map | User is able to view the availability in terms of client and server side calls. |  |
|||
| Live Metrics Stream | User can able to view the current incoming, outgoing request and server health on the go. | 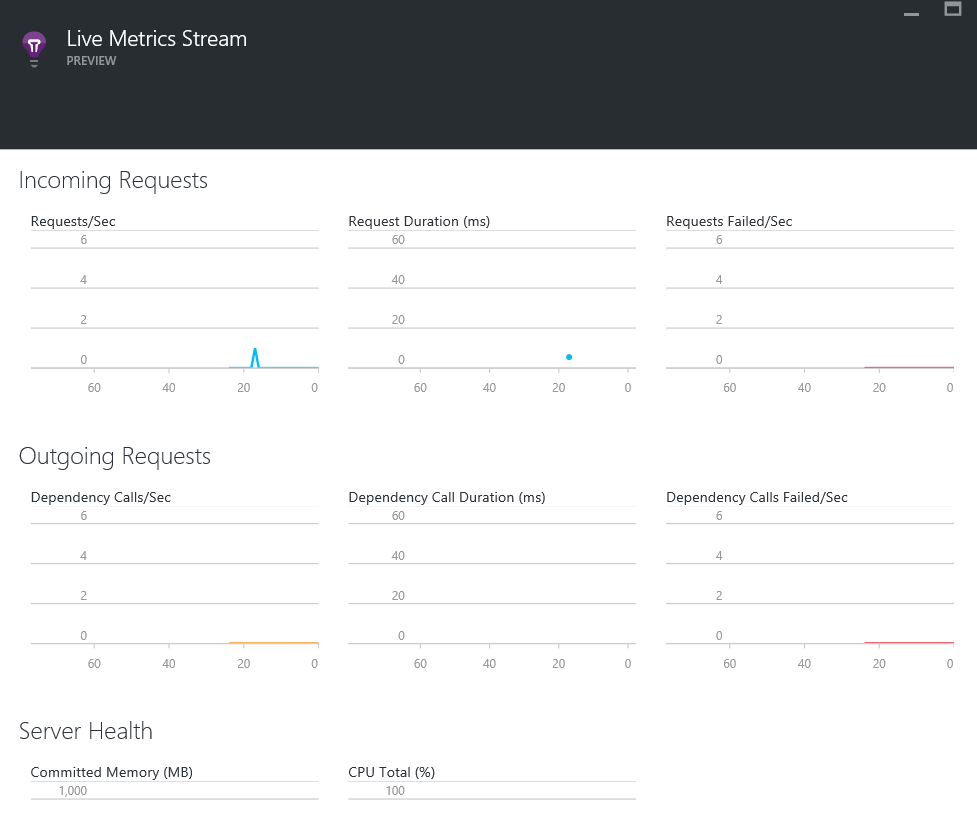 |
|||
| Failures | User is able to view the failed request in this tab | ||||
| Performance | User is able to view the Server response in this tab | ||||
| Servers | Details regarding memory,cpu and role instance will be displayed here for the server | ||||
| Browser | Details regarding browser page load time,exceptions,dependency details | ||||
| Usage | a major chart for viewing the user level details and session details | ||||
| Properties | Instrument key is visible here | ||||
| Availability | Web tests details are available here with success failure charts | 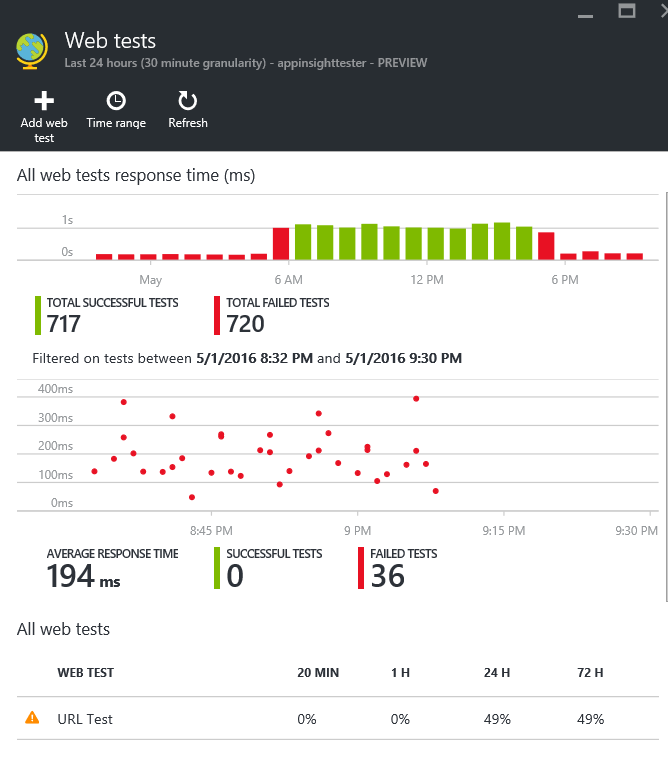 |
|||
| Alerts | User can add customer alert for any metric, a arithmetic condition, a threshold value and a valid period for the alert and also can send mail to different stakeholder. | ||||
| Continuos Export | Requires standard and premium tiers to export the data | ||||
| Performance Testing | Performance tests can be performed on the URL specified from this tab | ||||
| Quota Pricing | Details on the pricing is displayed here | ||||
| API Access | Application ID is displayed here. Typically the API Keys | ||||
| Users | This tab is used for adding a owner/contributor/reader etc | ||||
| Roles | User is able to view the roles here | ||||
| Tags | A key value pair is stored here | ||||
| Search | User can search a specific request/response occurred in the system. | On opening a single request/response, user can view event details/remote dependencies and related items | |||
| Metrics Explorer | This template shows us the major charts | Add Chart | User can add a custom chart with the below parameters:Chart Type, Aggregation value, Chart height, Color and major parameters for Availability/client/Failures/Performance Counters/Server/ Usage details | 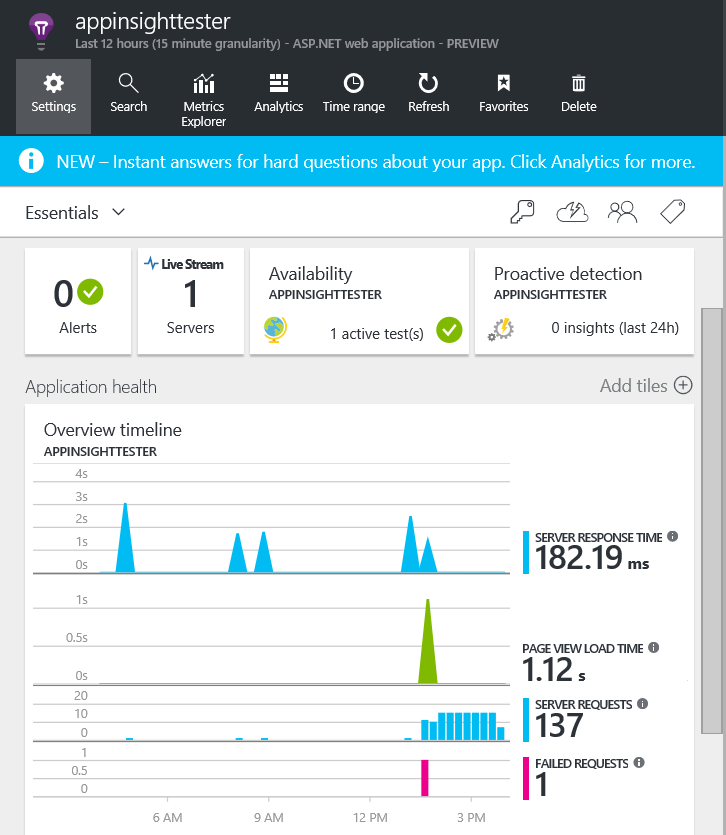 |
|
| Filters | |||||
| Alert Rules | User can add customer alert for any metric, a arithmetic condition, a threshold value and a valid period for the alert and also can send mail to different stakeholder. | ||||
| Export | Export all the data to a .xls sheet. | ||||
| Analytics | Portal to query the telemetry data and view it as a chart | Tutorials are available as in how to write the query and fetch the data in terms of performance/errors/Usage/Custom events. The sample example explains on "How did my app requests perform yesterday compared to the day before?" | 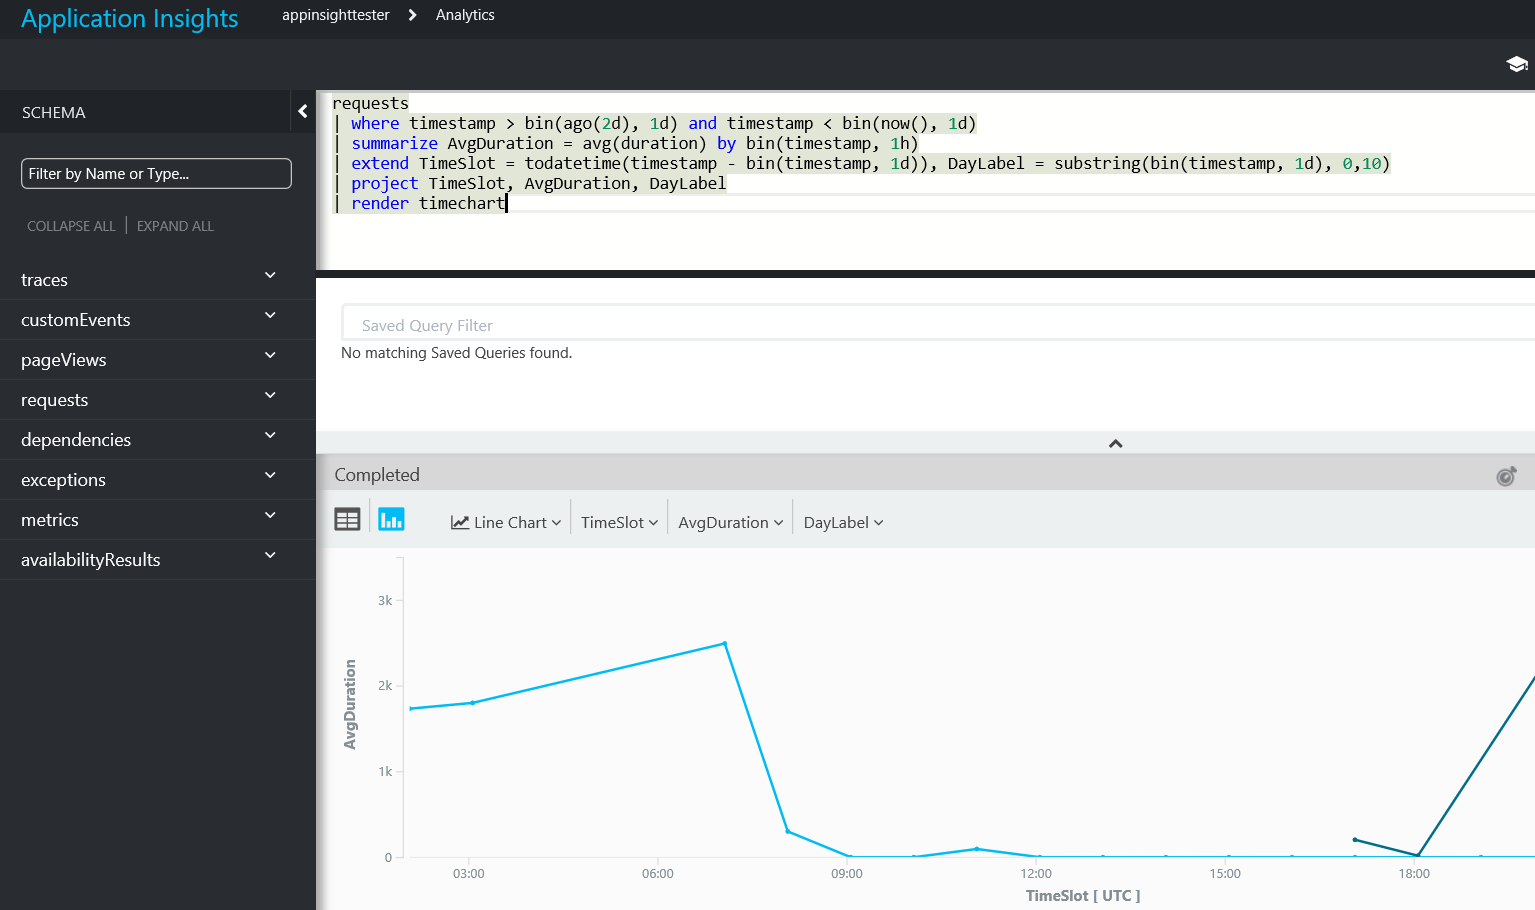 |
||
| Time Range | this helps the user in setting up the time range for which the telemetry data has to be displayed for | For a free pricing tier, the time range values is from 30 mins till 90 days | |||
| Refresh | On change of any setting or property, app insight does not reflect immediately, one has to manually refresh | ||||
| Favourites | Lists the favorites in the application insights | ||||
| Delete | Option to delete the application insight. |