Cook Book on Windows Mobile App Performance using Windows Performance Analyzer(WPA)
Windows performance Analyzer is a tool to evaluate the performance of windows applications. It can be used for analyzing the performance of windows applications.
Input file formats supported by the tool:
etl/wpa/xml/wpapk/zip files.
To start with, we will be going through the below sequence
How to Deploy Windows Phone app -> How install WPA -> How to extract Logs -> How to Analyze using WPA
How to deploy a Windows phone application?
There are three ways of doing the installation.
Windows Phone Application Deployment Tool / Visual Studio / Command Prompt.
Using Windows Phone Application Deployment tool.
Install the latest version of windows mobile application in emulator or device using windows phone application deployment.
Windows phone application deployment tool comes as a part of windows phone SDK.
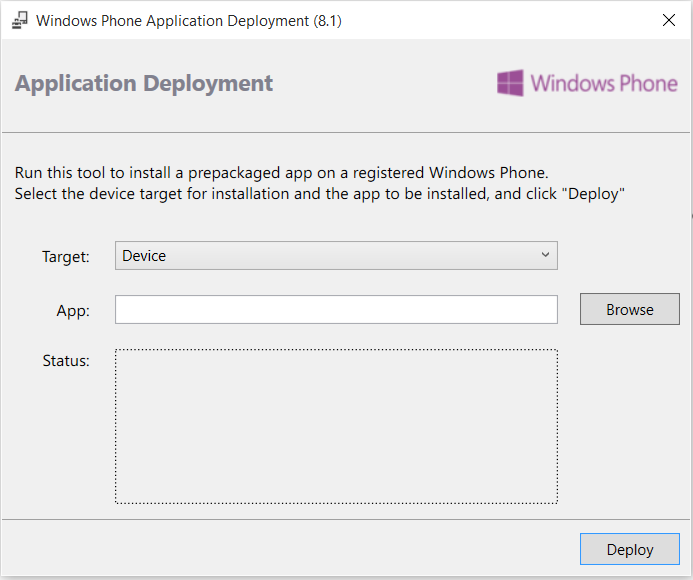
In the above tool, set the target as either device or the emulators as listed.
Browse the *.appx/*.xap/*.appxbundle and click deploy.
Application will be deployed.
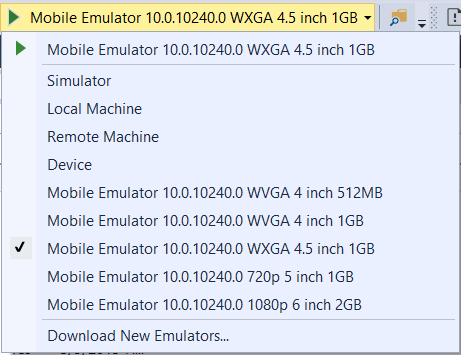
Deploy Using Visual studio
Open a windows phone project. Select the target device in the toolbar and run the project(F5).
Deploy using the command prompt
To deploy a windows phone 8/8.1 app in device. Use the steps below
Navigate to the below location
C:\Program Files (x86)\Microsoft SDKs\Windows Phone\v8.0\Tools\XAP Deployment.
And use the below command.
XapDeployCmd.exe /installlaunch filelocation*.xap /targetdevice:xd
To deploy a windows phone 10 app in device. Use the steps below
Navigate to the below location
C:\Program Files (x86)\Windows Kits\10\bin\x86\WinAppDeployCmd.exe
And use the below command.
WinAppDeployCmd install -file " filelocation*.appx" -ip [ipaddr] -pin A1B2C3
More information about WinAppDeployCmd can be found at below link.
https://msdn.microsoft.com/en-us/library/mt203806.aspx
How to Install WPA
Download the windows performance analyzer which comes as a package with Windows ADK.
https://msdn.microsoft.com/en-us/windows/hardware/dn913721(v=vs.8.5).aspx
Windows Performance Analyzer will be available under the below path
C:\Program Files (x86)\Windows Kits\10\Windows Performance Toolkit\wpa.exe
How Extract Log Files
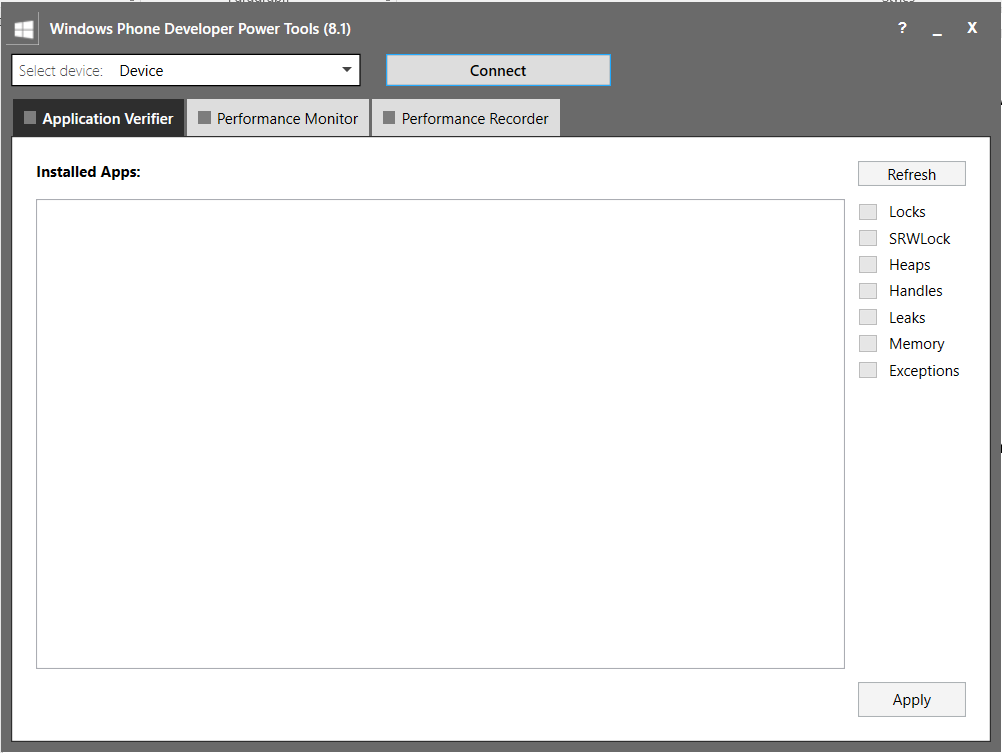
Open ‘Windows Phone Developer Power tools’ from the below path which comes as a part of Windows Phone SDK.
C:\Program Files (x86)\Microsoft SDKs\Windows Phone\v8.1\Tools\PowerTools\PwTools.exe
Choose the target as either device or the emulator.
Click Connect.
Make sure the connectivity is established between the device/emulator with the power tools.
App should be pre-installed in the emulator or device before the log is captured.
Navigate to Performance Recorder. Screen looks like the below one.
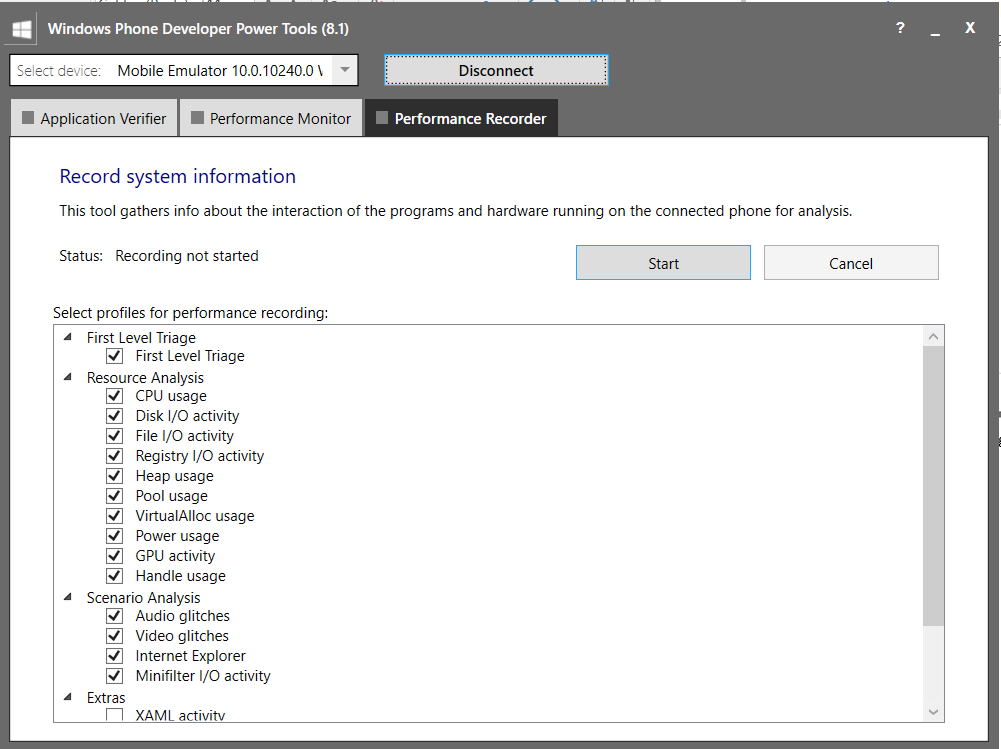
Select the profiles for performance recording in the bottom panel. And click on ‘Start’.
In the emulator(target device) open the app which needs to be evaluated. Do a set of execution and Press Stop in the above screen.
A file with *.etl format is saved.
How to Analyze using WPA
Open WPA from the below path.
C:\Program Files (x86)\Windows Kits\10\Windows Performance Toolkit\wpa.exe
File -> Open -> *.etl/*.xml/*.wap
Select a file which has any of the above format.
The below picture has mainly two panes. One on the left known as Graph Explorer and another on the right side Analysis.
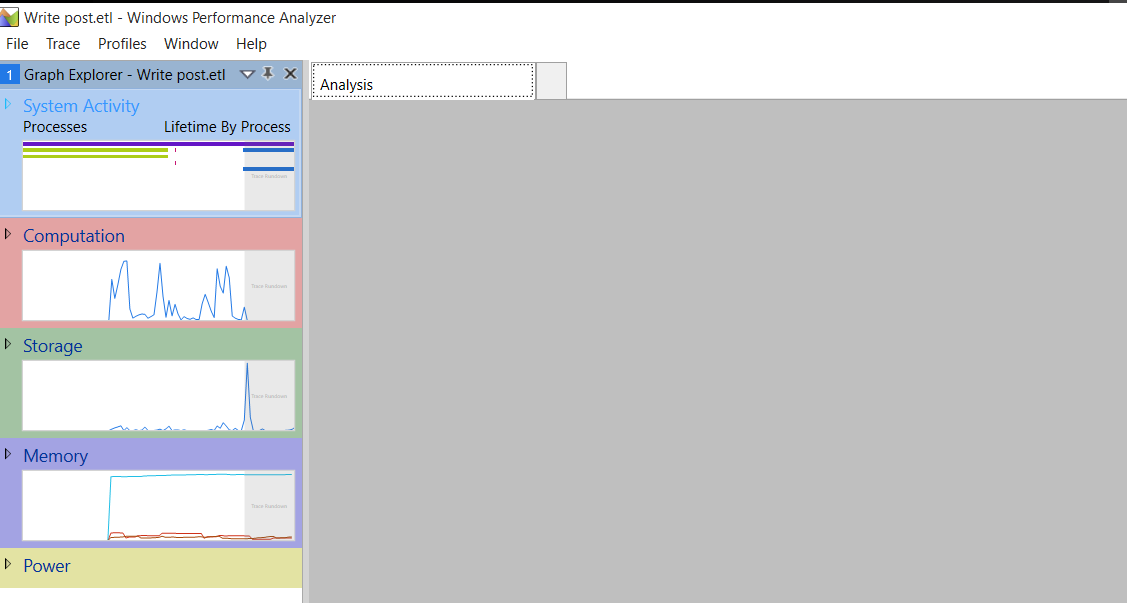
Graph Explorer:
Graph Explorer displays a list of thumbnails of all the graphs of the input file. Ex: System Activity/Computation/Storage/Memory/Power/Etc in the left pane.
Each thumbnail as stated above has sub divisions which are collapsed initially.
To view the detailed graph, select the thumbnail and drag it to analysis pane.
Analysis Tab
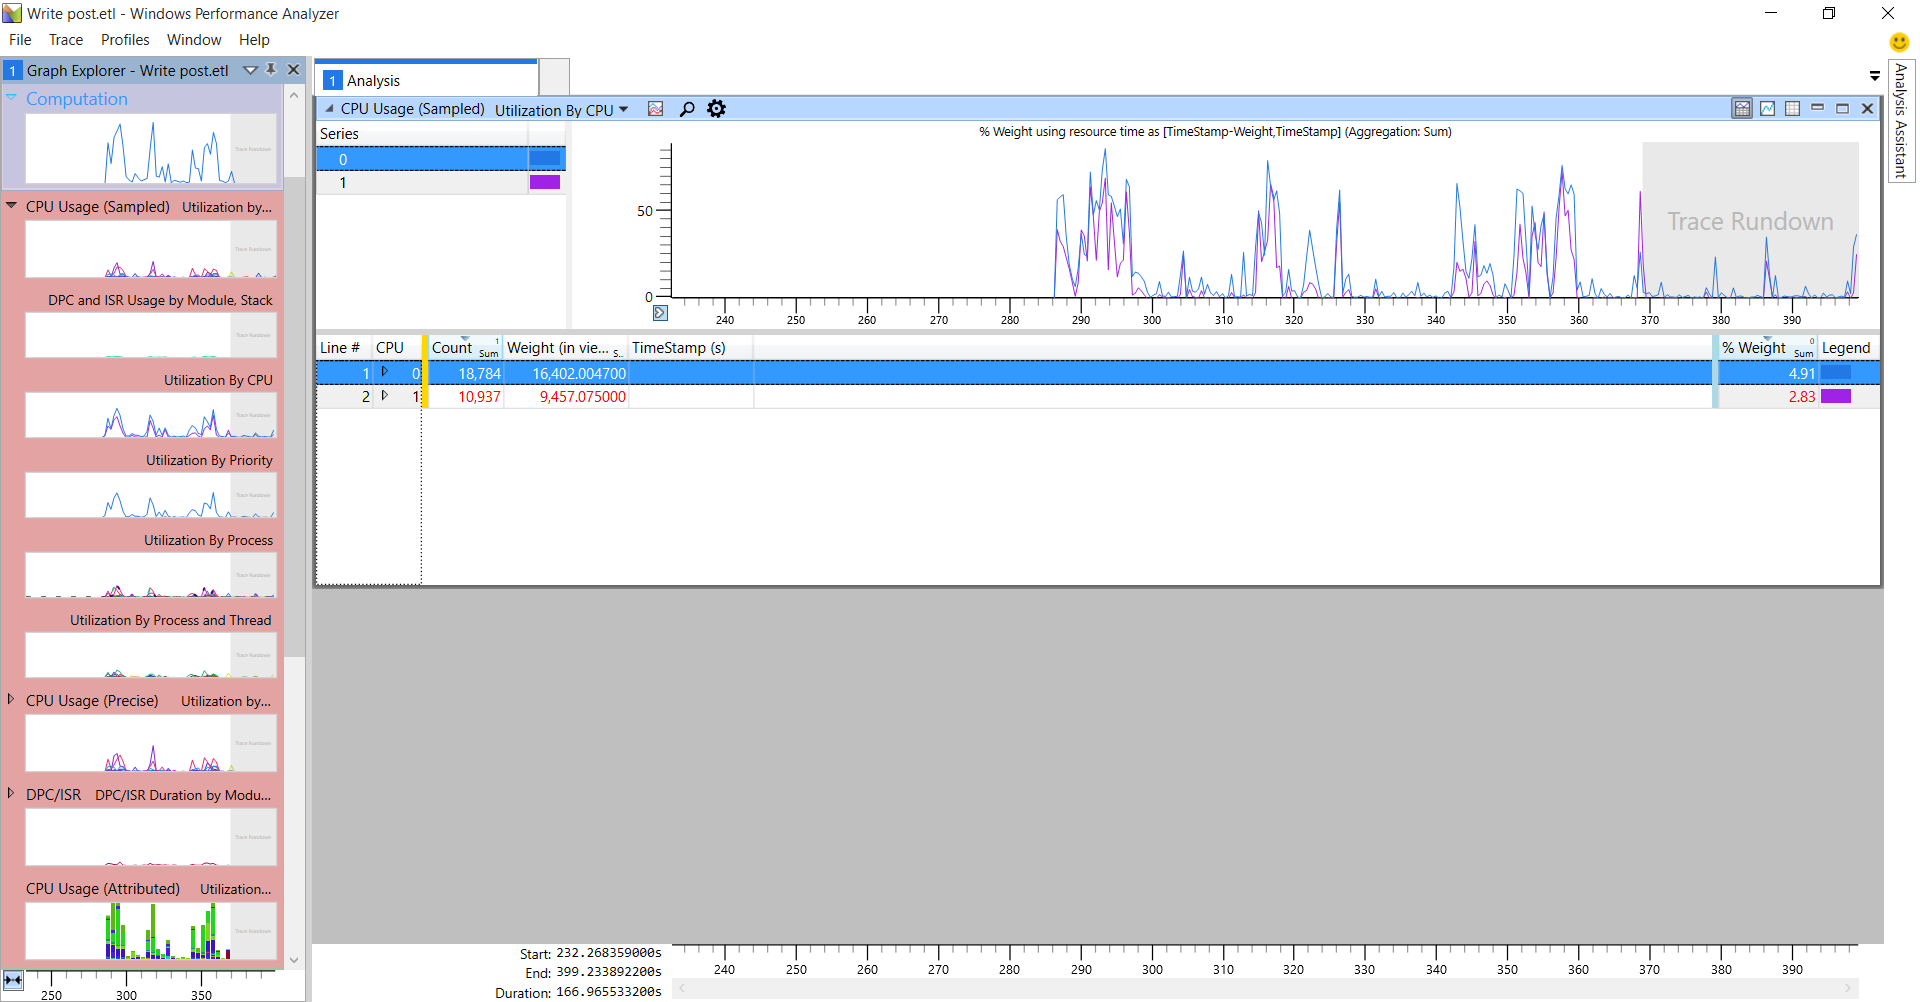
In the above picture, a portion of computation -> Utilization by CPU is taken into analysis.
Analysis pane has the option of zooming the selection and other options. And we have options of configuring the data table columns/ filtering the rows etc.
Analyze using default catalog
Navigate to 'Profiles'
Choose 'Apply'
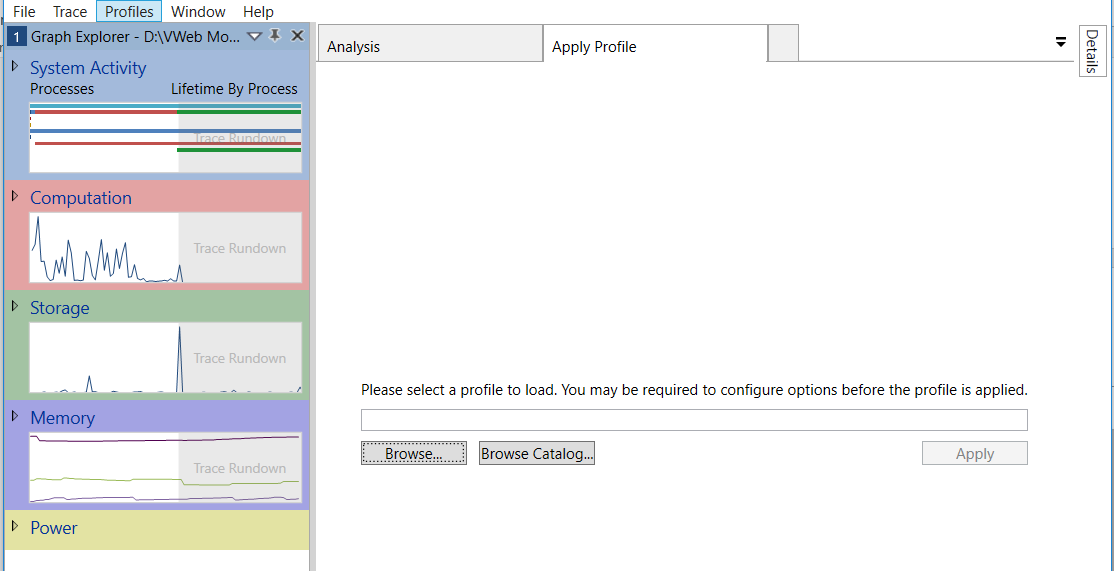
Click Browse Catalog.
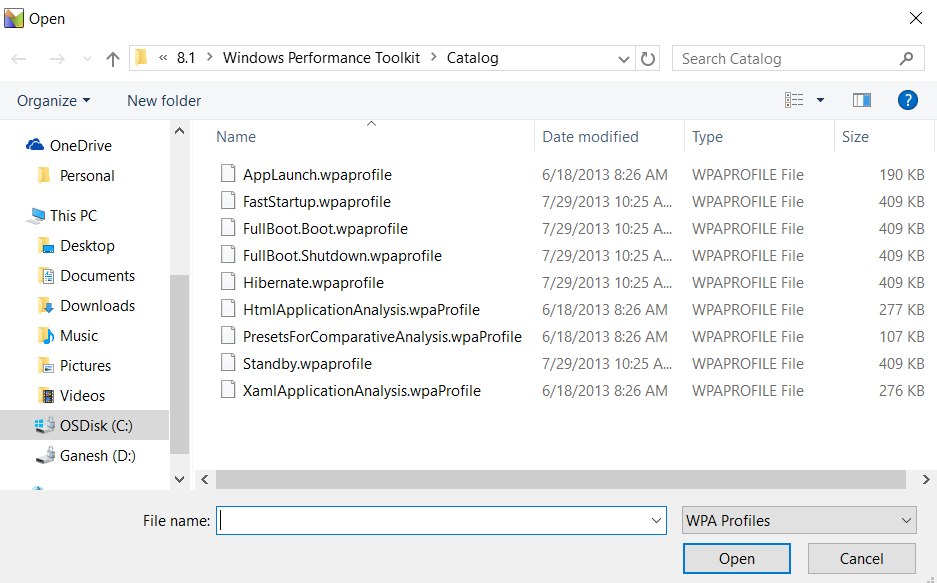
Choose a default catalog profile from the above and click open.
Based on the profile chosen(here I chose applaunch.wpaprofile) the graph will be altered as below.
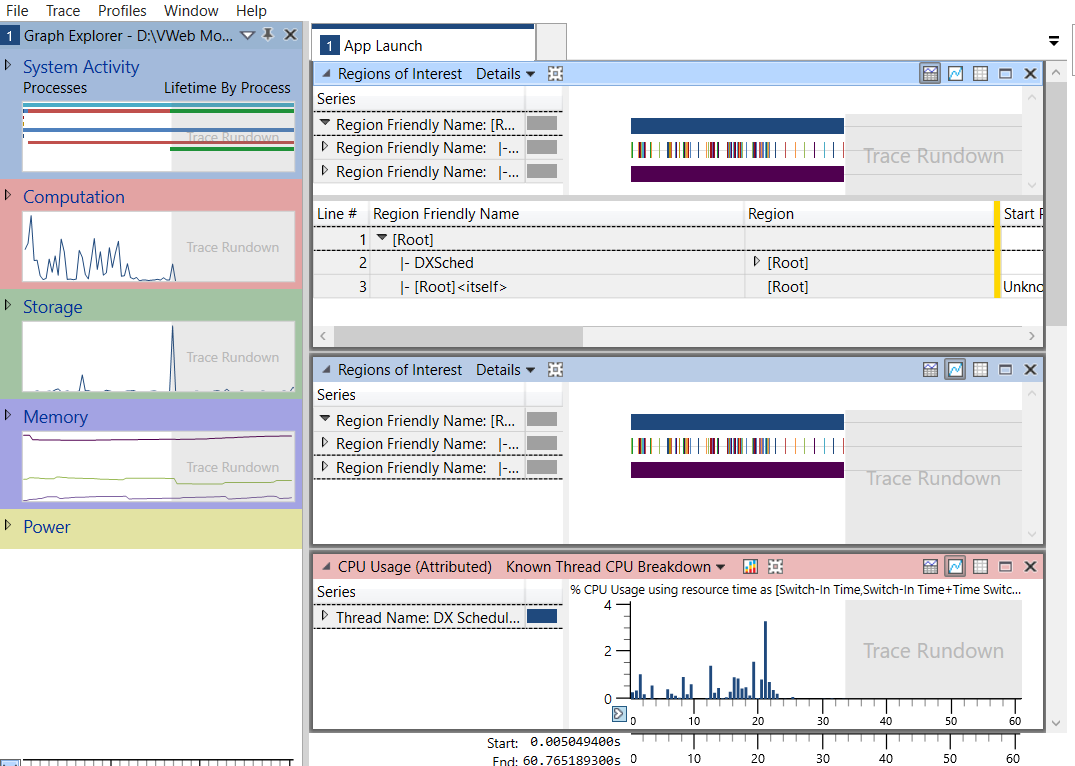
Major Parameters used to measure the performance of the mobile apps.
- Measuring the app launch time.
- Checking the app responsiveness w.r.t app’s response based on the UI input.
- Measure the Maximum Memory usage by app.
- CPU Utilization (directly proportional to battery usage).
- Out of memory issues caused by high resource usage.