Improving CLRProfiler 2: 19.7% in TryGetValue
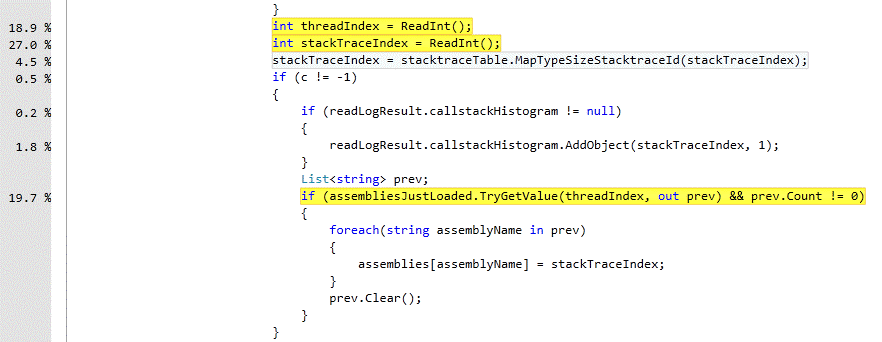
Playing with Visual Studio 2010 profiler data Function Code View finds another easy target for improvement: 19.7% in calling TryGetValue on a Dictionary object:

This piece of code is called in 'c' command process for logged method call information. There are just millions of method calls in the profile we're testing with.
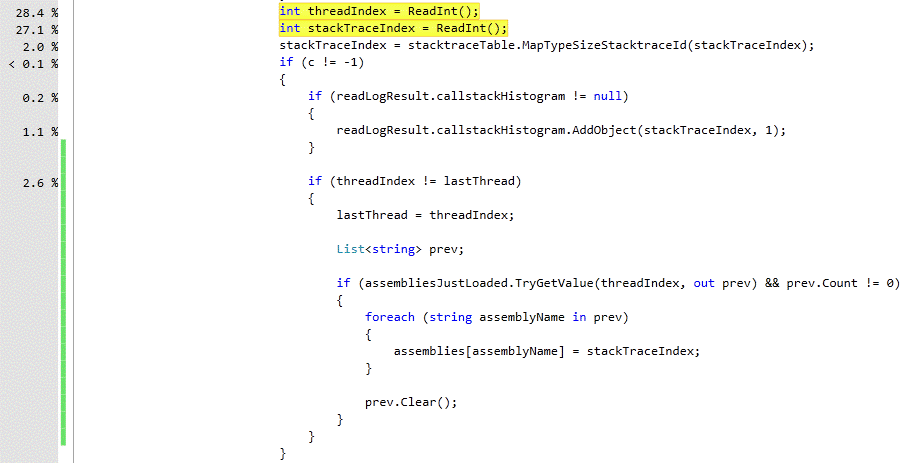
The code uses Dictionary::TryGetValue to see if a thread has unprocessed assembly information through the assembliesJustLoaded dictionary. If a thread has a list of unprocessed loaded assemblies, they are used to update the assemblies dictionary and then cleared. So if the same thread is used again before the assembliesLoaded dictionary is updated, the TryGetValue is not even needed. So we can easily remember the last thread ID used, avoid calling TryGetValue if the new thread ID is the same last the last one, unless assembliesJustLoaded dictionary is updated.
This simple change makes the TryGetValue call on assembliesJustLoaded completely invisible to the profiler:

Here are two 10 most expensive functions before and after the change:

