Improving CLRProfiler 1: 8.4% Progress Bar Update
Being a CLR performance dev, it seems that CLR profiler will be a very useful. So now I'm trying to understand it inside out, and may be even make some improvement to it.
Here are the steps I'm taking:
- Download CLR profiler 4.0 source code.
- Unzip, open solution using Visual Studio 2010, making a few small setting changes to make it build 32-bit binary.
- Copy .dlls generated to ClrProfiler.exe directory.
- Run ClrProfiler first to generate a small profile: CLRProfiler.exe -l cp0.csv -p CLRProfiler.exe. This command profiles CLRProfiler itself showing it dialog boxes. It generates 5.8 Mb profile cp0.csv
- Run ClrProfiler again to generate a bigger profile: CLRProfiler.exe -l cp1.csv -p CLRProfiler.exe -l cp0.csv. This command profiles CLRProfiler itself loading up the first profile. It generates a 157 Mb profile cp1.csv.
- Use Visual Studio 2010 Performance Wizard to profile CLRProfiler loading up cp1.csv.
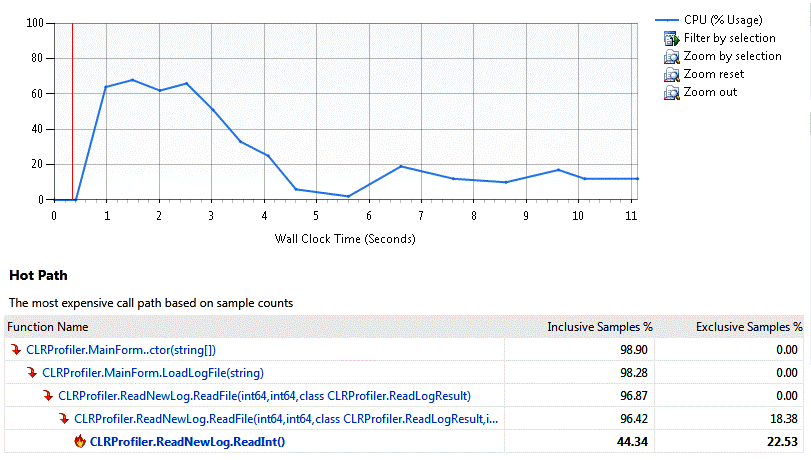
Performance Wizard (Visual Studio 2010 Sample Profile) shows the following summary page:

It shows that most of the time is spending on loading the profile, almost half of it is on reading integers.
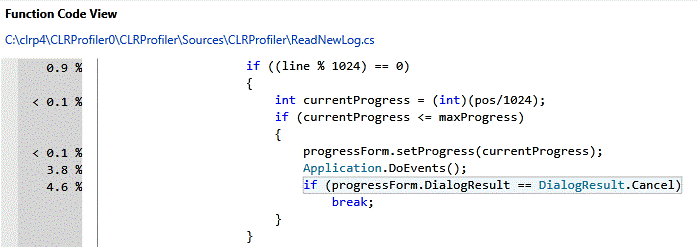
Let's deal with this later, and focus on a simpler problem. If you play with the profiler's analysis, you will find that the following code updaing progress bar/calling DoEvents is consuming 8.4% of CPU.

The problem with ths code is that it's updatng progress bar and calling Application.DoEvents too often. To be more specific, it's updating every 1,000 lines. For the 157 Mb profile, there are actually 11 million lines, so the code within the 2nd if clause is executed 11,000 times.
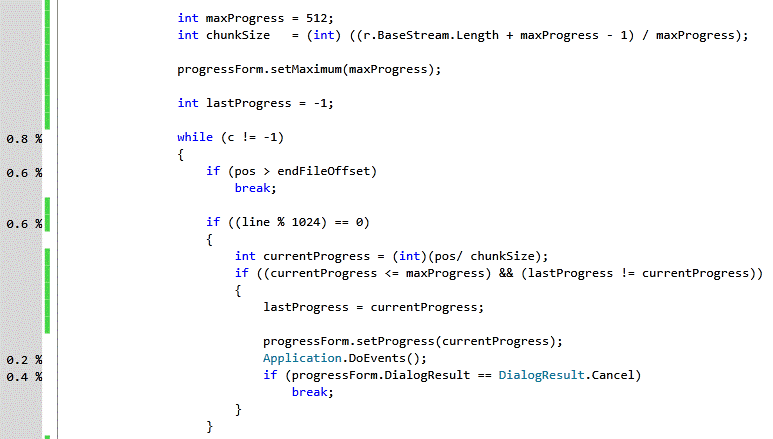
It we limit the numbers of updates to 512 times, 8.4% is now reduced to 0.6%:

Now CLRProfiler is little bit faster.
Let's look at top 10 most costly functions (sorted by exclusive samles) before and after the change:


Not very professional perf measurements, but you can clearly see we knocked two WinForm functions out of the top 10 contributors.