Easy debugging of CGI / FASTCGI application
Debugging CGI/FastCGI issues on IIS can be tricky because of the multiple processes involved (application pool process(s) – w3wp.exe – and CGI process(es) – typically php-cgi.exe). You may already be aware of the following step-by-step article which describes how to debug CGI: HOW TO: Debug Common Gateway Interface Applications Running Under IIS by Using Visual Studio. In this article, I will be demonstrating a simple method to trap CGI output using WinDbg. I've used this method a couple of times to dump out CGI output causing typical issues like this one: CGI Error:The specified CGI application misbehaved by not returning a complete set of HTTP headers.
For the needs of our debug lab, I will use the following setup :
- IIS 7.5 setup with Fast CGI PHP support
(https://learn.iis.net/page.aspx/246/using-fastcgi-to-host-php-applications-on-iis/) - err500.php page that produces an HTTP 500 error :
<?header('HTTP/1.1 500 Internal Server Error');?>
As expected, accessing the above page from IE shows HTTP 500 error:
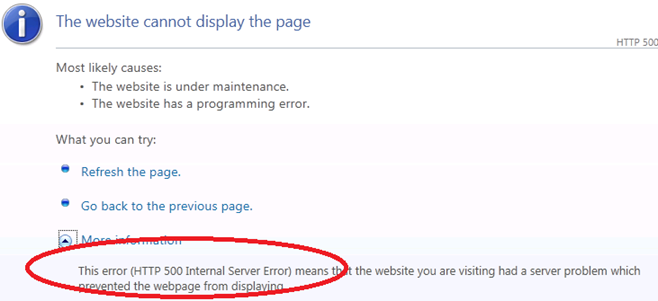
A FREB trace clearly shows that the HTTP 500 error is set by the FastCgiModule:
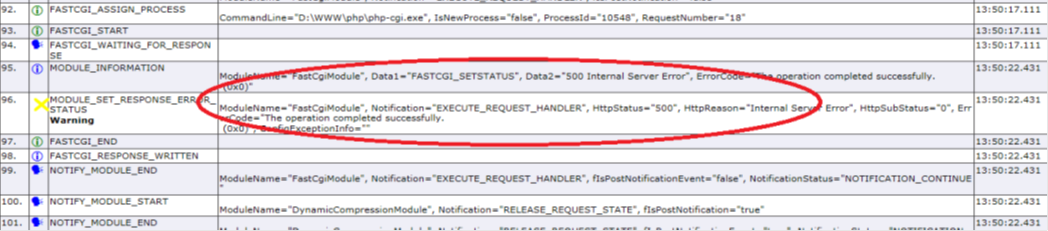
What occurs in our scenario is that the FastCGI module is submitting the request to a php-cgi process. The result of the php execution (HTTP 500) is then passed back to the FastCgiModule. Let's confirm this using the debugger:
Install Debugging Tools (https://msdn.microsoft.com/en-us/windows/hardware/gg463009.aspx)
Attach Windbg to the application pool (W3WP) – if you don't know which application pool to attach to, use this article : Which w3wp.exe PID corresponds to which application pool ?
Setup symbol path as needed, use the ".childdbg 1" command to instruct windbg to break when child process is created and type g to resume execution (commands to type are in bold) :
0:037> .sympath SRV*c:\pubsymcache*https://msdl.microsoft.com/download/symbols
Symbol search path is: SRV*c:\pubsymcache*https://msdl.microsoft.com/download/symbols
Expanded Symbol search path is: srv*c:\pubsymcache*https://msdl.microsoft.com/download/symbols
0:037>
.reloadReloading current modules
................................................................
0:037> .childdbg 1
Processes created by the current process will be debugged
0:037> gAt this point, let's access our err500.php page from Internet Explorer. This will produce the following output in Windbg:
Executable search path is:
ModLoad: 00000000`00d50000 00000000`00d5e000 php-cgi.exe
ModLoad: 00000000`778a0000 00000000`77a49000 ntdll.dll
ModLoad: 00000000`77a80000 00000000`77c00000 ntdll32.dll
<snip>
(36c8.178c): Break instruction exception - code 80000003 (first chance)
ntdll!LdrpDoDebuggerBreak+0x30:
00000000`7794cb60 cc int 3Now that we are in the initialization sequence of php-cgi.exe, we can place a breakpoint on WriteFile to dump output from php-cgi (Note : if php-cgi makes use of WriteFile() from some other reason (ex : write content to disk), this output will also be dumped…) :
1:037> bp kernel32!WriteFile "db poi(esp+8) l poi(esp+(3*4))"
Bp expression 'kernel32!WriteFile' could not be resolved, adding deferred bpNote : If the child CGI process is running on a 64 bit architecture (x64), you can use the following breakpoint :
bp KERNELBASE!WriteFile "db rdx l r8"let's resume execution of php-cgi.exe :
1:037> g
the following output is displayed and we then break on kernel32!WriteFile :
<snip>
020918c4 01 06 00 01 00 5a 06 00-53 74 61 74 75 73 3a 20 .....Z..Status:
020918d4 35 30 30 20 49 6e 74 65-72 6e 61 6c 20 53 65 72 500 Internal Ser
020918e4 76 65 72 20 45 72 72 6f-72 0d 0a 58 2d 50 6f 77 ver Error..X-Pow
020918f4 65 72 65 64 2d 42 79 3a-20 50 48 50 2f 35 2e 34 ered-By: PHP/5.4
02091904 2e 36 0d 0a 43 6f 6e 74-65 6e 74 2d 74 79 70 65 .6..Content-type
02091914 3a 20 74 65 78 74 2f 68-74 6d 6c 0d 0a 0d 0a 20 : text/html....
02091924 0d 0a 00 00 00 00 00 00-01 03 00 01 00 08 00 00 ................
02091934 00 00 00 00 00 00 00 00 ........
kernel32!WriteFile:
76a117e1 ff25e409a176 jmp dword ptr [kernel32!_imp__WriteFile (76a109e4)] ds:002b:76a109e4={KERNELBASE!WriteFile (7614d3a2)}using the k command, we can see the callstack up to the WriteFile call :
1:037:x86> k
ChildEBP RetAddr
00a4cb5c 68939bde kernel32!WriteFile
00a4e668 68939d37 MSVCR90!_write_nolock+0x67e
00a4e6ac 00d56bc6 MSVCR90!_write+0x9f
WARNING: Stack unwind information not available. Following frames may be wrong.
00a4e6d0 00d570e2 php_cgi+0x6bc6
00a4e6e8 00d5221b php_cgi+0x70e2
00a4e6f4 64633d15 php_cgi+0x221b
You can use the above method to debug any CGI/FASTCGI issue and hopefully point the root cause of issues dealing with missing headers, CGI process crash…etc
Happy CGI/FastCgi Debugging!
Emmanuel