Managed Debugging with WinDBG and PSSCor2
If you are anything like me, you have developed ASP.net applications, debugged them using Visual Studio, made sure that they work reasonably well, and then sent them over to the production servers to start using them with real live users. So what happens if you see that there are bugs in production, and you don't know from where they are coming or what exactly is going on when the exception is raised? Since you don't have Visual Studio, the first and natural answer is you panic. Then you start looking at alternates.
This article aims to explore a powerful debugging alternative to Visual Studio – the Windows Debugging Tools for managed code debugging. It will walk you through attaching a debugger to a site that is already in production, breaking on an exception, and using other neat commands that come with the PssCor2 debugging extension.
So what is WinDBG?
For those of you that have never heard about this debugger before, you can think of it as the mother of all debuggers – it comes with the Windows Debugging Tools, that can be downloaded free from the Microsoft website. You must be sure you pick the right debugger architecture for your system: if you are running on a 32 bit system (x86) versus a 64 bit system (x64) versus an itanium 64 bit system (ia64) – the last is only possible if have an Itanium process on your server. So go ahead and download the Windows Debugging Tools from:
(Note: I have placed a link with the new link bookmarking tool that I have written – www.linqto.me - this allows me to share the link very easily with anyone I need to and also keep it up to date towards the latest distribution of WinDBG)
So why WinDBG and not Visual Studio? Visual Studio needs to be installed on a server, something most server administrators will not agree to – while WinDBG is just files you need to copy over, no installation and no component registration is needed. But perhaps the biggest reason is that WinDBG can extract a lot more information about the various threads that are inside the process and how they are executing in comparison with Visual Studio which has a more mono-threaded developer oriented approach.
Just download the latest Debugging Tools for Windows, and then either install them directly on your server, or install them on your development machine and transfer the %Program Files%\Debugging Tools for Windows\ folder onto your server.
And PssCor2 ?
As sophisticated as the debugger can be, it does not do everything out of the box. Fortunately, the developers of WinDBG left room for expanding the functionality offered by WinDBG via debugging extensions. One of these extensions is called PssCor2 – and was developed by engineers from Microsoft Support: hence the name – Premier Support Services – PSS. This extension contains all the commands you will ever need to start debugging managed code using WinDBG. You can download the extension from the following location:
When you download the extension, execute the installer – which will just unzip psscor2.dll – this is the debugger extension. All you need to do is to copy this file inside the Debugging Tools for Windows.
Attaching the Debugger
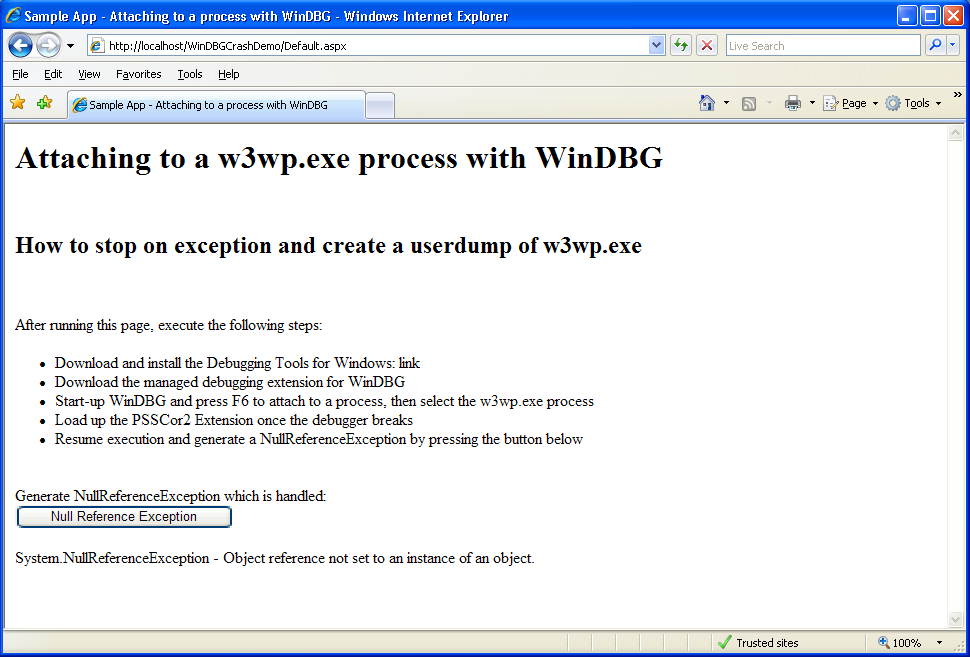
Now that we have introduced the needed components, here is what you need to do to start debugging. First, download the demo ASP.net application that I have created for this purpose from here and deploy it to the IIS website or virtual directory of your choice. Make sure that you can access Default.aspx and that it renders as shown in the screenshot below:
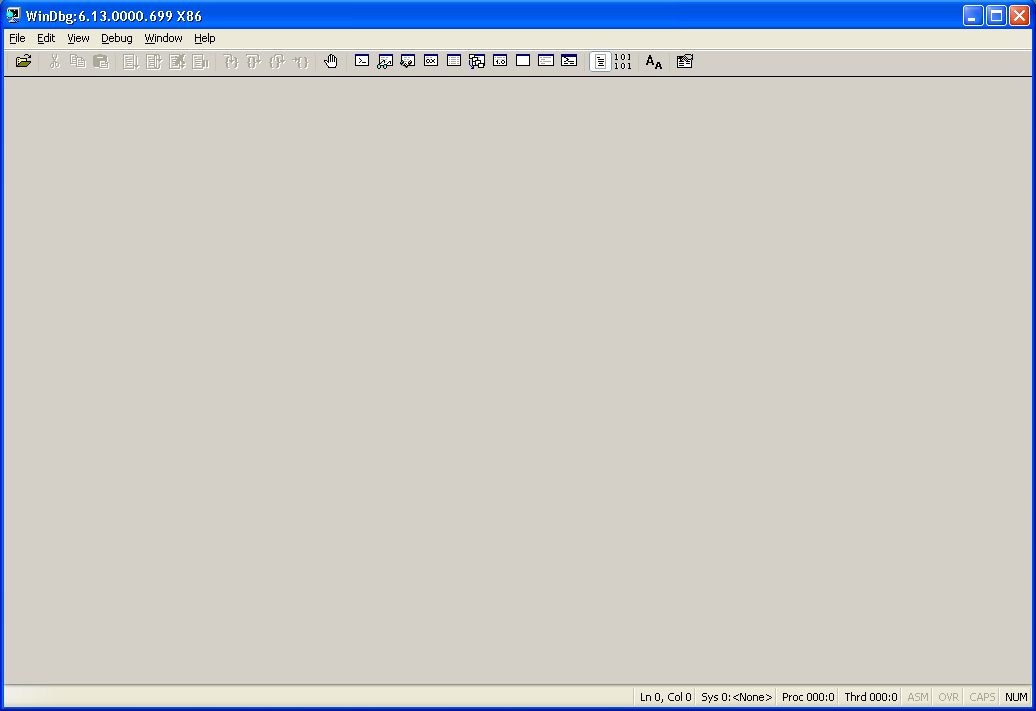
Once the site is up and running, go ahead and start the debugger. You can find the executable in the %Program Files%\Debugging Tools for Windows\ folder. Once started the debugger should look like the screenshot below:
Debugging Symbols
The first thing you need to do is to set the symbol file path. Think of symbols as a sort of blueprint for a compiled piece of code. When native code gets compiled, it gets turned into assembly language – addresses and instructions. The method names and higher level variable names are lost. To be able to know what address corresponds to which instruction or variable in the high level code, you need to have the debugging symbols for that component.
Microsoft offers the public debugging symbols for all Microsoft non-managed components. These symbols offer limited debugging information about the Microsoft components. They are located on a special 'share' called a symbol server, to which the debugger knows how to connect to if you are able to point out its address. So here is the address for the public debugging symbols:
https://msdl.microsoft.com/download/symbols
Go into the File menu of the debugger, and click on the Symbol File Path menu item and type in the following:
srv*C:\Symbols\symserv* https://msdl.microsoft.com/download/symbols
What this does is it instructs the debugger to load symbols for components that you are debugging from a folder called Symbols\symserv on your C:\ drive (you may change this if you need). If the symbol file is not found inside this folder, the debugger will download it from the Microsoft symbol server, and place it in the Symbols\symserv folder which will be used as a cache.
If you want to have more information on setting up symbol servers for debugging, check out this link:
https://support.microsoft.com/kb/311503
Attaching to the process
Once the debugging symbols are setup, you are now ready to attach to the w3wp.exe process that is running the IIS application pool for the demo application. Click the File menu of the debugger, and then the Attach to Process menu item to reveal the list of currently running processes you can attach to. If you have more than one instance of w3wp.exe, check this blog post to see which one is the one of interest. Select the w3wp.exe process and then click 'Attach'.
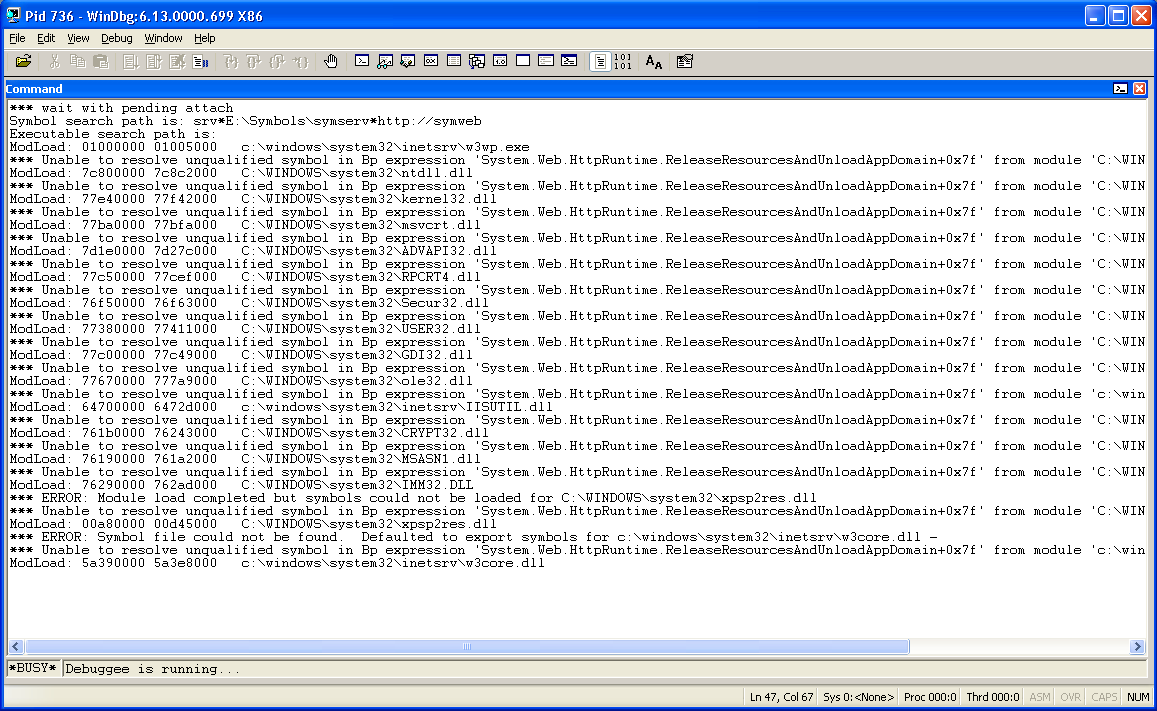
The debugger will open a new window and start outputting what it is doing while it is attaching to the process. You will see the debugger loading up the various symbols for the Microsoft native components that are present in the process – as shown in the screen shot below:
Once the debugger finishes attaching to the process, it will break (stop the execution of the w3wp.exe process) and will await instructions from you – much like Visual Studio would do when you would hit a breakpoint. You will see that the debugger will indicate something like:
0:021>
This means that you are debugging the first process (and in this case the only one) that you are attached to, and that the currently executing thread (before hitting the breakpoint) was thread 21.
Loading PssCor2
By default, the managed debugging extension PssCor2 is not loaded inside the process, so in order to able to access its command subset, we must load it up first. To do so, type the following commands, and hit enter after each command:
.cordll -u -l
.loadby sos mscorwks
.load psscor2
Let's review the commands. The first command will just show if there were any other load attempts for psscor2. The second is much more interesting: it instructs the debugger to look at the version of mscorwks.dll – this is the execution engine of the .Net Managed Runtime and load the sos.dll managed debugging extension to go with the version of the Runtime that is loaded in memory. Sos is a managed debugging extension that comes with the .Net Framework or Silverlight and allows basic debugging of managed code. Psscor2 basis its functionality on the functionality exposed by sos.dll but goes one step further offering a much richer feature set.
Following the loading of PssCor2 in memory, and before continuing process execution, you need to execute one more command:
sxe 0
This means that we want the debugger to Stop on Exception – for all exceptions. I will come back in later post to explain exception handling in more detail. But for now, this command will allow the debugger to break when an exception is raised and presented to the application. Following this, we can resume process execution, by typing the following command:
g
for go!
Trap an error
Now return to the Internet Explorer window where you opened the sample application and click on the button to generate a System.NullReferenceException. When you do this, you should get an output similar to the one below (please note that the thread number might be different).
(2e0.198): Access violation - code c0000005 (first chance)
First chance exceptions are reported before any exception handling.
This exception may be expected and handled.
eax=029230c0 ebx=028bb718 ecx=02942980 edx=02942800 esi=02942910 edi=02942800
eip=024d0578 esp=01f4f318 ebp=01f4f34c iopl=0 nv up ei pl zr na pe nc
cs=001b ss=0023 ds=0023 es=0023 fs=003b gs=0000 efl=00010246
App_Web_bthszxfy!_Default.GenerateNullRefException()+0x28:
024d0578 8b1500000000 mov edx,dword ptr ds:[0] ds:0023:00000000=????????
*** WARNING: Unable to verify checksum for c:\WINDOWS\Microsoft.NET\Framework\v2.0.50727\Temporary ASP.NET Files\windbgcrashdemo\30b3ab6f\f9f7fd18\assembly\dl3\3496d575\0d833cd2_e849cb01\App_Web_bthszxfy.DLL
*** ERROR: Module load completed but symbols could not be loaded for c:\WINDOWS\Microsoft.NET\Framework\v2.0.50727\Temporary ASP.NET Files\windbgcrashdemo\30b3ab6f\f9f7fd18\assembly\dl3\3496d575\0d833cd2_e849cb01\App_Web_bthszxfy.DLL
Unable to enumerate managed locals, HRESULT 0x80004001
*** Unable to resolve unqualified symbol in Bp expression 'System.Web.HttpRuntime.ReleaseResourcesAndUnloadAppDomain+0x7f'.
0:016>
The next thing you can do is just to type in:
!clrstack
This will show you the managed stack that caused the Null Reference Exception and it should look like the one below:
!clrstack
OS Thread Id: 0x198 (16)
ESP EIP
01f4f318 024d0578 _Default.GenerateNullRefException()
01f4f354 024d0536 _Default.cmdNullReferenceException_Click(System.Object, System.EventArgs)
01f4f35c 667990b8 System.Web.UI.WebControls.Button.OnClick(System.EventArgs)
01f4f374 66798f1f System.Web.UI.WebControls.Button.RaisePostBackEvent(System.String)
01f4f38c 6679915b System.Web.UI.WebControls.Button.System.Web.UI.IPostBackEventHandler.RaisePostBackEvent(System.String)
01f4f394 66095b9e System.Web.UI.Page.RaisePostBackEvent(System.Web.UI.IPostBackEventHandler, System.String)
01f4f3a0 66095af5 System.Web.UI.Page.RaisePostBackEvent(System.Collections.Specialized.NameValueCollection)
01f4f3b4 660a7cfe System.Web.UI.Page.ProcessRequestMain(Boolean, Boolean)
01f4f50c 660a7584 System.Web.UI.Page.ProcessRequest(Boolean, Boolean)
01f4f544 660a74b1 System.Web.UI.Page.ProcessRequest()
01f4f57c 660a7446 System.Web.UI.Page.ProcessRequestWithNoAssert(System.Web.HttpContext)
01f4f588 660a7422 System.Web.UI.Page.ProcessRequest(System.Web.HttpContext)
01f4f59c 024d0145 ASP.default_aspx.ProcessRequest(System.Web.HttpContext)
01f4f5a0 660ad8f6 System.Web.HttpApplication+CallHandlerExecutionStep.System.Web.HttpApplication.IExecutionStep.Execute()
01f4f5d4 6608132c System.Web.HttpApplication.ExecuteStep(IExecutionStep, Boolean ByRef)
01f4f614 6608c3a3 System.Web.HttpApplication+ApplicationStepManager.ResumeSteps(System.Exception)
01f4f664 660808ac System.Web.HttpApplication.System.Web.IHttpAsyncHandler.BeginProcessRequest(System.Web.HttpContext, System.AsyncCallback, System.Object)
01f4f680 66083e1c System.Web.HttpRuntime.ProcessRequestInternal(System.Web.HttpWorkerRequest)
01f4f6b4 66083ac3 System.Web.HttpRuntime.ProcessRequestNoDemand(System.Web.HttpWorkerRequest)
01f4f6c4 66082c5c System.Web.Hosting.ISAPIRuntime.ProcessRequest(IntPtr, Int32)
01f4f8d8 79f9816e [ContextTransitionFrame: 01f4f8d8]
01f4f90c 79f9816e [GCFrame: 01f4f90c]
01f4fa68 79f9816e [ComMethodFrame: 01f4fa68]
The last to do is to generate a memory dump of the process in this state so that you may review this later. To achieve this, type in the following command:
.dump /u /ma c:\debug\w3wp.dmp
This command will generate a full memory dump of the process. The file will named w3wp followed by the process PID and date, so as to not overwrite previously existing files and will be generated in the c:\debug folder.
With the dump taken, you may now detach the debugger from the debugger from the process. Note that just closing the debugger down will kill the process being debugged, which may not be what you want. To avoid this and leave the w3wp.exe alive, type the following:
qd
for 'quit debugge', following which you are ready to quit the debugger.
And there you have it, a first look at Live Debugging with WinDBG. Come back soon for more.
by Paul Cociuba - ASP.net Engineer
Follow what I read via Linqto.me