Benchmark your BizTalk Server (Part 3)
Previous Parts:
For more information:
Benchmark your BizTalk Server (Part 1)
How to install:
Benchmark your BizTalk Server (Part 2)
Drill Down on BizTalk Baseline Wizard
Now that you understand what the tools is let’s look at how it can be used in a realistic situation. The tool provides a simple Orchestration and a messaging scenario which you can use to test your BizTalk Server deployment. In this post I am going to walk through
· Running the tool against a default BizTalk environment e.g. BizTalk and SQL Server have been installed on an operating system with the default configuration
· Demonstrate the techniques I use here in our Redmond Performance labs to analyze and determine the bottleneck in a BizTalk Server solution. This will include looking at perfmon counters and SQL Dynamic Management Views
Scenarios
To refresh here are the scenarios:Scenario 1: Messaging

- Loadgen generates a new XML message and sends it over NetTCP
- A WCF-NetTCP Receive Location receives a the xml document from Loadgen.
- The PassThruReceive pipeline performs no processing and the message is published by the EPM to the MessageBox.
- The WCF One-Way Send Port, which is the only subscriber to the message, retrieves the message from the MessageBox
- The PassThruTransmit pipeline provides no additional processing
- The message is delivered to the back end WCF service by the WCF NetTCP adapter
Scenario 2: Orchestration

- Loadgen generates a new XML message and sends it over NetTCP
- A WCF-NetTCP Receive Location receives a the xml document from Loadgen.
- The XMLReceive pipeline performs no processing and the message is published by the EPM to the MessageBox.
- The message is delivered to a simple Orchestration which consists of a receive location and a send port
- The WCF One-Way Send Port, which is the only subscriber to the Orchestration message, retrieves the message from the MessageBox
- The PassThruTransmit pipeline provides no additional processing
- The message is delivered to the back end WCF service by the WCF NetTCP adapter
My Deployment
The tests for this blog post were done on the kit below. A EMC Clarion CX-960 storage array with 240 disk drives was used as our back end storage. We used a single SQL Server with 16 logical processors (cores) and 64 GB of memory. I was fortunate enough to have access to four Dell R805 machines which are Dual Processor Quad Core with 32 GB RAM. Two of these were used for BizTalk, one to generate load and one to host the simple back end WCF service. Please note the specification of the hardware used here for the load generator servers and WCF service box is many times greater than is actually required, they were simply what was available for us in the lab at the time.

BizTalk Server 2009 and SQL Server were installed with their default configuration with the following exceptions:
1) TempDB log and data file were moved to a dedicated 4+4 RAID 10 LUN
2) The default data file location in the SQL setup was configured to be a dedicated 8+8 RAID 10 LUN
3) The default log file location for the SQL instance was configured to be a dedicated 8+8 RAID 10 LUN
4) For simplicity sake the recovery model for the BizTalk databases was set to simple. Because we do not use bulk logged operations the level of logging is still the same we avoid having to perform clean up of the log after every testing run. This should not be done in a production environment
5) The BizTalk MessageBox data and log files were set to a size of 5GB and
Running The Test – Messaging Scenario
We installed the tool, see https://blogical.se/blogs/mikael/archive/2009/11/26/benchmark-your-biztalk-server-part-2.aspx for detailed instructions. The tool was installed on two servers so that I could run the load client on one server and the WCF service on another, it is of course possible to run both on the same.
As shown in the table below the results that we got from the first run were 789 messages/sec across a ten minute test.
Change |
Configuration |
Avg Processor Time (BTS Receive) |
Avg Processor (BTS Send) |
SQL Processor |
Received Msgs/sec |
Send msgs/sec |
Default BizTalk and SQL Configuration |
2 BizTalk (8 cores each), 1 SQL 16 CPU |
50 |
53 |
62 |
789 |
789 |
The first thing that I examine to determine whether a BizTalk environment is properly configured and balanced is the receive and send rate for this use case should be approximately equal throughout the test. This is measured using the BizTalk:Messaging\Documents Processed/Sec performance counter for the send side and BizTalk:Messaging\Documents received/sec performance counter for the receive side. This perfmon screenshot shows a subsection of the tests I ran. As you can see from the graphic below in my test they were approximately equal throughout.

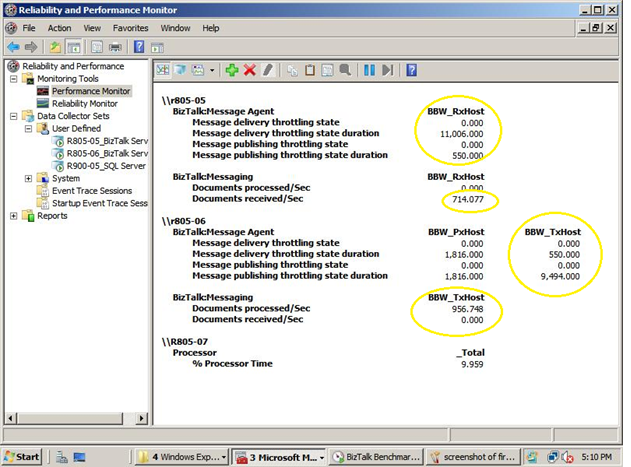
Typically the next step that I take is to examine the Message Delivery (outbound) and Message Publishing throttling (inbound) counters for all my BizTalk host instances. These can be found under the “BizTalk:Message Agent” perfmon object, there is an instance of each counter per host. Each BizTalk host can be in a number of different throttling states, the state shifts if throttling thresholds such as database size, inbalance between send and receive rates and numerous more are breached. The links below provide full information on this, to summarize a throttling state of 0 is good because this means that the engine is running at maximum speed. When looking at these counters it is important to check that throttling state duration, if the value of this for one host is small it indicates that either it was restarted or that throttling occurred.
How BizTalk Server Implements Throttling
The screenshot below shows the rate counters (Documents Processed and Received per second) for my hosts as well as the throttling state and duration for each of the hosts. The BBW_RxHost throttling state duration is 550 compared to 9494 seconds for the BBW_TxHost. In this case it was because I restarted the receive host just before our test run started.
What was SQL Server Doing During This Time
It is now important to examine the SQL Server tier and understand what is affecting performance here. A good starting point is to look at the following counters
· Processor\% Processor Time
· Memory\Available Mbytes
· Logical Disk\Avg. Disk sec/Read
· Logical Disk\Avg. Disk sec/Write
If the processor utilization is high then examine the privileged and user mode time, high privileged mode, which is typically defined as greater than 20%, can indicate that the box is I/O bound. ON a 64-bit SQL Server running with greater than 16 GB of RAM I would expect at least 500 Mbytes of RAM to be available. When examining the logical disk counters indicated it is important to look at each of the individual instances not just the total instance. For SAN LUNs if you are seeing response times less than 5 milliseconds for reads or writes you are very likely hitting the SAN cache.
BizTalk Database and the Buffer Pool
The primary purpose of the buffer pool (also known as the buffer cache) in SQL Server is to reduce intensive disk I/O for reading and writing pages. When an update is made to a page to reduce future read and write operations it remains in the buffer pool until the buffer manager needs the buffer area to read in more data. Modern 64 bit servers now regularly have 32 GB or more RAM available, because the size of most BizTalk MessageBox databases is just several GB in size, this means that the data pages for it can be kept in memory. The benefit of this is that under these conditions an insert or update to the MessageBox will only require a log write to physical disk, the data page will be modified in the Buffer Pool memory. The modified, known as a dirty page, will be written to disk by the checkpoint process during its next execution. This flushing of dirty pages to disk is done to minimize the amount of traffic that needs to be replayed from the transaction log in the event or an unexpected or unplanned server restart. For more information on the Buffer Pool see https://msdn.microsoft.com/en-us/library/aa337525.aspx
SQL Server conveniently exposes information about the Buffer Pool through perfmon. From the SQL Server:Buffer Manager perfmon object look at the following counters:
· Buffer Cache Hit Ratio: A value of 100 means that all pages required for read and write were able to be retrieved from the Buffer Pool
· Lazy Writes/sec: This is the mechanism that SQL Server uses to remove pages from the buffer pool to free up space. This indicates that the instance is under some memory pressure at the time
· Checkpoint Pages/sec: Use this counter to determine when checkpoint is occurring. To ensure that your disk sub-system can keep up with the rate please ensure that Avg Disk Sec/Write does not go above 15 milliseconds when the checkpoint spike occurs. For further information see https://msdn.microsoft.com/en-us/library/ms189573.aspx
SQL Server also provides the SQL Server:Memory Manager perfmon counter object. Target Server Memory (KB) indicates the amount of physical memory that SQL Server can allocate to this instance. In the screenshot below you can see that this is approximately 57 GB. The Total Server Memory (KB) indicates the amount of memory that is currently allocated to the instance, in our case this is approximately 20 GB, which indicates that there is memory headroom on the box and pressure is not likely to occur on the buffer pool. This of course assumes that the value of the Memory\Available Mbytes counter is not low.
Note: It is expected behavior that the Total Server Memory Counter will increase in value over time. SQL Server will not free up memory as this is an expensive task and could degrade performance in a number of ways including reducing the memory available to cache data and index pages in the buffer pool, hence increasing I/O required, therefore increasing response times as I/O is slower than memory access. If the operating system indicates that there is global memory pressure on the server then SQL will release memory. The min and max server memory settings can be used to manually control the amount of memory that each SQL instance can address. I have found this most useful when running multiple instances on the same server. See https://msdn.microsoft.com/en-us/library/ms178067.aspx for more information.

Since we now know that BizTalk Server is not resource bound or throttling and SQL Server does not appear to be resource bound by memory, disk or processor either we will delve deeper.
DMV’s - Delving Further Into SQL Server
SQL Server 2005 introduced Dynamic Management Views (DMVs) which provide instance wide and database specific state information. To explain the full scope of what DMVs offer is outside the scope of this article, indeed there are several books written on this topic.
From our initial analysis using perfmon we do not appear to be resource bound. When executing concurrent high throughput loads SQL Server worker threads often have to wait either to gain access to a particular database object, for accesss to a physical resource and numerous other factors. When this occurs SQL Server will write the current Wait Type to the DMVs. This is useful for troubleshooting as we will see.
The following query can be used to display the current waiting tasks.
SELECT wt.session_id, wt.wait_type
, er.last_wait_type AS last_wait_type
, wt.wait_duration_ms
, wt.blocking_session_id, wt.blocking_exec_context_id, resource_description
FROM sys.dm_os_waiting_tasks wt
JOIN sys.dm_exec_sessions es ON wt.session_id = es.session_id
JOIN sys.dm_exec_requests er ON wt.session_id = er.session_id
WHERE es.is_user_process = 1
AND wt.wait_type <> 'SLEEP_TASK'
ORDER BY wt.wait_duration_ms desc
Script can be downloaded here: List%20Current%20Waiting%20Tasks.sql
The screenshot below is a snapshot from the first test run, the waits are ordered by wait duration. The WAITFOR can be ignored as this is defined explicitly in code and is hence intended. The second wait type is a PageLatch_Ex, this is a lightweight memory semaphore construct which is used to ensure that two schedulers do not update the same page within the buffer pool. The resource description column displays the value 8:1:176839. This refers to the page in the buffer pool that that session 72 is attempting to take the exclusive latch on, the leading 8:1 indicates that it is database 8 (the Message Box), file 1.
select DB_NAME(8) -- Use this to resolve the name of the database

The dbcc traceon command enables trace flag 3604 which exposes further information about the page via DBCC Page with the following syntax:
dbcc page(8,1,176839, -1)
The page is m_type 3 which is a data page. The ObjectID that this page relates to is 1813581499. For more information on using DBCC Page see:
How To Use DBCC Page https://blogs.msdn.com/sqlserverstorageengine/archive/2006/06/10/625659.aspx

By using select OBJECT_NAME(1813581499)we can determine that the wait is latch is waiting on the spool table. This makes sense because the spool table is a shared table across the BizTalk group, every time a message is inserted into the MessageBox a row needs to be added to the spool. Because the row size of the spool table is relatively small, multiple rows will be present on each page (up to 8 KB), therefore on a large multi-CPU SQL Server this can result in latch contention on these data pages.

I then proceeded to look at several of the pages in the list, going in descending order by wait time. The first few where all waiting for a shared or exclusive latch on a page from the spool table. The next page that was of interest was 8:1:258816, the output from DBCC Page is shown below in the screenshot. Pay attention to the M_Type value which in this case is 11. M_Type 11 is significant because this refers to a PFS page. PFS stands for Page Free Space, this page holds allocation and free space information about pages within the next PFS interval, which is approximately 64 MB. This structure is to used to ensure that multiple schedulers (SQL’s term for CPU) do not access the same page at the same time. On a high CPU system this can become a bottleneck. Because there is a PFS page per 64 MB chunk of each database file a common best practice technique which is used to alleviate this is to create as many files per filegroup as there are schedulers (CPU’s) in your system. This is what we will do next, whilst we are it we will also fix one of the other common allocation bottlenecks within SQL Server by creating multiple TempDB data files.

For more information on allocation bottlenecks and PFS see:
What is an allocation bottleneck: https://blogs.msdn.com/sqlserverstorageengine/archive/2009/01/04/what-is-allocation-bottleneck.aspx
Under the covers: GAM, SGAM and PFS Pages:
Anatomy of a page:
https://www.sqlskills.com/blogs/paul/post/Inside-the-Storage-Engine-Anatomy-of-a-page.aspx
Easier Way To Troubleshoot Latch Contention
Before we move onto the next test run where wie will add more files to the MessageBox and TempDB databases to alleviate allocation issues. Let’s explore another technique which some of my colleagues from our SQLCAT team shared with me. One of the drawbacks of drawing conclusions from point in time snapshots is that it can result in false positives or negatives. The attached script takes 600 samples over an approximate 60 second period (precise run time depends on the size of your buffer pool) from the sys.dm_os_waiting_tasks DMV view and aggregates all this information together, in addition it uses a number of other DMV views including sys.dm_os_buffer_descriptors to display the actual object name that is the waiting resource for the latch. This information is aggregated in a temporary table, by adjusting the number of samples that the query uses you can gain an understanding of what your MessageBox is waiting for when under load. Now let’s look at the output that I got in the screenshot below.

Script can be downloaded here:
Modified%5E_LatestFindWaitResource.sql
You can see that the majority of wait time was actually spent in our tracking data tables, this means that by disabling tracking by configuring the global tracking option in the adm_group table in the management database I can reduce the latching that I get in my system. To minimize the changes I make between test runs let’s make the change to the number of MessageBox and TempDB files first…