WebMatrix – Creating a Custom Chart Template
This post shows you how to create a custom chart template based on an existing theme in WebMatrix Beta 2.
The ChartTheme class includes built-in themes. You can create a page to display the XML contained in a built-in theme, and then create a custom template file based on that theme.
Create a new file named ThemeSourceViewer.cshtml.
Replace the default markup in the page with the following:
Code Snippet
- <!DOCTYPE html>
- <html>
- <head>
- <title></title>
- </head>
- <body>
- @ChartTheme.Vanilla3D
- </body>
- </html>
The above code displays the XML contained in the Vanilla3D property of the ChartTheme class.
Run the page in a browser.
In the browser window, select the displayed XML and copy it. This XML represents the Vanilla3D theme property of the ChartTheme class. It will appear as a continuous line of text in the browser, rather than text with indentation as shown below.
Code Snippet
- <Chart BackColor="#555"
- BackGradientStyle="TopBottom"
- BorderColor="181, 64, 1"
- BorderWidth="2"
- BorderlineDashStyle="Solid"
- Palette="SemiTransparent"
- AntiAliasing="All">
- <ChartAreas>
- <ChartArea Name="Default"
- _Template_="All"
- BackColor="Transparent"
- BackSecondaryColor="White"
- BorderColor="64, 64, 64, 64"
- BorderDashStyle="Solid"
- ShadowColor="Transparent">
- <Area3DStyle LightStyle="Simplistic"
- Enable3D="True"
- Inclination="30"
- IsClustered="False"
- IsRightAngleAxes="False"
- Perspective="10"
- Rotation="-30"
- WallWidth="0" />
- </ChartArea>
- </ChartAreas>
- </Chart>
Create a new XML file at the root of your web site named CustomTemplate.xml .
Replace the default markup in the file with the copy from the XML displayed in the browser (or from the code above).
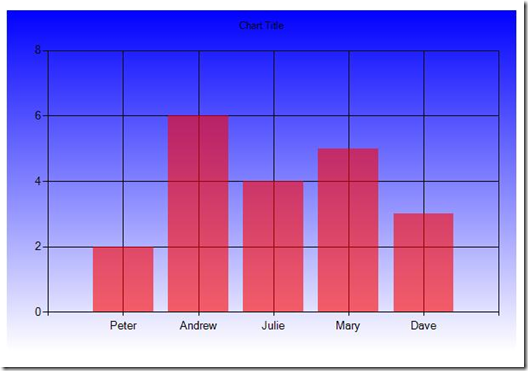
Set the BackColor of the Chart node to “Blue”.
Set the Enable3D value in the new XML to "False".
Save the CustomTemplate.xml file.
At the root of your website, create a new file named ChartWithCustomTemplate.cshtml.
Replace the default markup in the page with the following:
Code Snippet
- @{
- var key = new Chart(width: 600,
- height: 400,
- templatePath: "CustomTemplate.xml")
- .AddTitle("Chart Title")
- .AddSeries(
- name: "Employee",
- chartType: "Column",
- xValue: new[] { "Peter", "Andrew", "Julie", "Mary", "Dave" },
- yValues: new[] { "2", "6", "4", "5", "3" })
- .Write();
- }
Run the ChartWithCustomTemplate.cshtml page in a browser.
-- Erik Reitan
Web Platform and Tools Developer Content
This posting is provided "AS IS" with no warranties, and confers no rights.
