How to Debug a Web Part for SharePoint 2007
I thought I would enumerate the steps required to conduct debugging when developing an ASP.NET Web Part for WSS 3.0/SharePoint 2007.
Situation:
Without debugging capabilities and the ability to step through code of a web part, developers are relegated to deploying their assembly to the SharePoint virtual directory and waiting for the output. The developer can only do things like Response.Write programatic elements in response to .NET exceptions that are displayed in SharePoint when the web part doesn't work as expected.
You know you need debugging of ASP.NET web parts in WSS 3.0/MOSS when:
- You are attempting to find the source of your exception by climbing through the stack trace output to the screen when an exception occurs
- You are dumping the contents of variables/data sets/objects to the screen using the Response.Write method
- Tasks that with a debugger to step through code would take hours take a day or longer
- You curse the heavens as another NullReferenceException rears its ugly head
- You say "this feels a lot like ASP development from the late '90s"
- You think to yourself, "If I could only step through this code,"
Solution:
Based on this and some real life experiences that shaped my article "Team-Based Development in Microsoft Office SharePoint Server 2007" (https://msdn2.microsoft.com/en-us/library/bb428899.aspx), here are some ways to make web part development (assembly-based development) in WSS 3.0/MOSS easier. The first tennant is that I would prompt everyone to develop on their own VM with the following rudimentary specifications
- Windows 2003 SP2
- SQL Server 2005 SP2 Developer's Edition
- Office 2007
- Visual Studio 2005 (including the Extensions for SharePoint).
This beats working on a shared server conducting development because firstly, you are working locally with the MOSS object model so the voodo about getting remote debugging to work is moot. Secondly, you don't have to coordinate server reboots, iisresets, etc. You can take your development environment home and work detached from the corporate network.
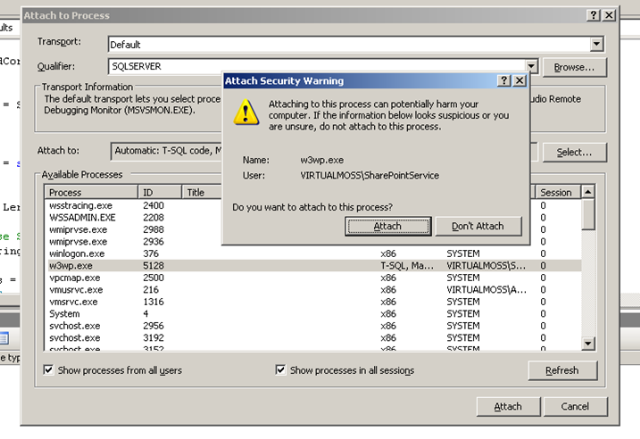
Because the development environment is local, debuging is easier as well. Based on the screenshot below, you can see that the attached to process works well because we are on the local machine:
The basic steps are as follows:
- Open the solution with the web part(s)
- Copy the assembly (after it has been built) to the bin directory of the WSS web site and be sure to include the.pdb files
- Deploy the web part (copy to the bin with the pdb as above, import the part into the web part gallery so it is visbile, create a smaple page and add the web part to the page in design view and publish the page)
- Place a break point on the code of interest in Visual Studio
- Under the Debug Menu, select Attach to Process
- Find the w3wp.exe process. If none exists, begin browsing to the site that has the web part you are debugging. (I usually conduct an IIS reset so that all of the w3wp.exe processes go away and the sole one that you are interested in is easier to find)
- Watch as the page processes and as soon as your web part is hit, Visual Studio will load symbols and begin the debugging process
Hopefully now, rather than climbing thorugh stack traces, Response.Write output, etc. you can conduct full-fidelity debugging and shave days off of a task that would only take hours.