Report on Opportunities Lost to Competitors
There is an out-of-the box relationship between competitors and opportunities in CRM that allows you to track many competitors to any one opportunity. However, when you close an opportunity as lost to a competitor, you may select one specific competitor within the Close Opportunity window. This is a different relationship in CRM than competitor to opportunities.
What if you want an all-up view of all your lost opportunities showing the competitors that you lost to?
When trying to get this report, many people naturally turn to advanced find views (AFVs) to try to create a query for this data. This approach won’t return all the data you need in an all-up Lost Opportunity report with Competitors because you cannot create an AFV on the Opportunity Close Activity. The closest you can get with AFV is to look for Activities, filter the Activity Type = Opportunity Close, and filter Competitor = [fill in the blank].
This only works when filtering one competitor because you cannot display a column for Competitor in this view – there is a 1:N relationship between Activity and Opportunity Close.
Thus, the way to get this view of your data is to create a Report (Workplace –> Reports)using the report wizard. The report wizard differs from AFV in that it allows you to JOIN data from different data tables (entities) rather than be restricted to lookup fields in 1:N relationships between data tables (entities). Here’s how to do it:
Go to Workplace –> Reports –> Report Wizard:
Name the report and specify primary and related record types:
Set a filter to return all activities = opportunity close (like I mentioned with the AFV), and Opportunity Close Competitor “contains data”:
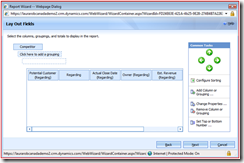
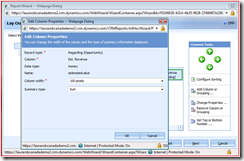
Lay out fields in your report. In this example I’ve included Est. Revenue on the related Opportunity so you can quantify exactly how much revenue was lost to the competitor. You can summarize by this amount in your report in order to create a chart in the next step:
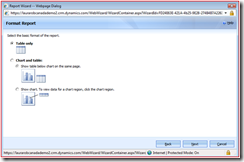
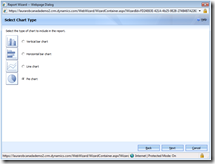
Add a chart if you want to:
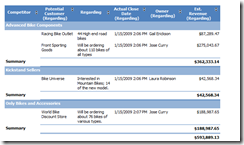
Final Report:
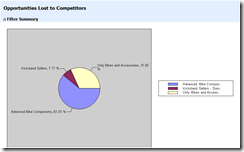
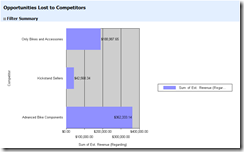
With pie chart or bar chart:
Enjoy.


