
Classifying costs using the Costing sheet functionality
This short blog post explains in detail how to use the costing sheet functionality to classify and aggregate costs.
Scenario
Let’s start with a simple example: assume that our company produces jewelry. The company procures raw materials: gold, silver, platinum and precious stones, and converts them into beautiful necklaces, rings, and earrings.
Ken, the cost controller is given the task to assess how the trend of raising precious metal prices is going to affect the cost of a particular finished good. To do this, he navigates to details of BOM calculation (Inventory management / Costing versions / Item price / Complete).
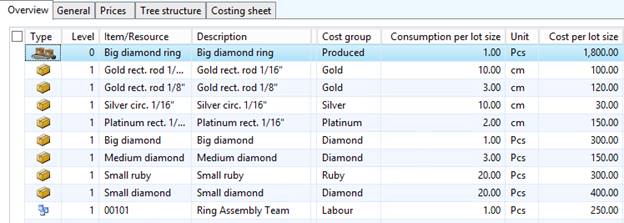
Unfortunately, the detailed view doesn’t provide any aggregation level. Ken is troubled: in order to figure out the exact cost of consumed precious metals, he has no other choice than copying the data to Excel and running calculation there… or has he?
Setting up the costing sheet to aggregate costs
This is where the costing sheet becomes handy. Ken can use the costing sheet setup form (Inventory management / Setup / Costing / Costing sheets) to define aggregation of his costs.
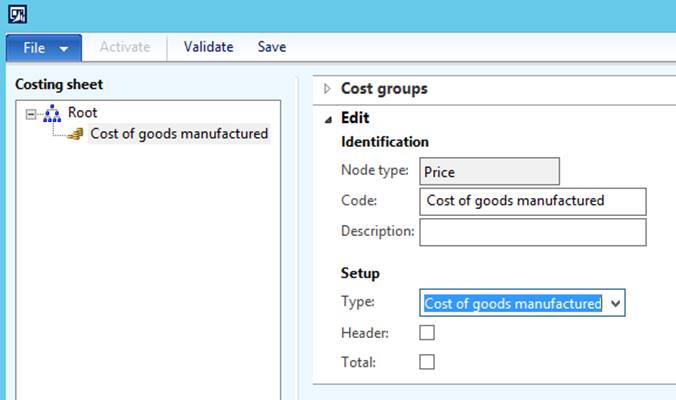
Let’s help Ken and create a new node of type Price. Nodes of type Price instruct the costing sheet in which context a given structure will be used. Ken wants to classify his manufacturing costs, so let’s change the type to “Cost of goods manufactured”.
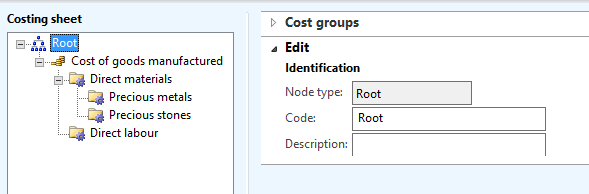
Now we can add nodes underneath it. Let’s add a node of type Total and name it “Direct materials” and another two total nodes right beneath for “Precious metals” and “Precious stones”. Also let’s create a “Direct labor” total node underneath the “Cost of goods manufactured”. The result should look like the following:
Now we can start adding cost groups to our structure. We can do that in two ways – either by creating a new node of type cost group underneath the Total node or by simply dragging the cost group from the “Cost groups” fast tab to the node where we want to place them. Let’s drag and drop cost groups Gold, Silver, Platinum to the Precious metals node, “Diamond” and “Ruby” to the “Precious stones”, “Labor” to the “Direct labor”. As it is a best practice to have all cost groups mapped in the costing sheet let’s add the “Produced” cost group to “Cost of goods manufactured”. Now let’s simply validate and save our structure. The result should be following:

Revisiting results
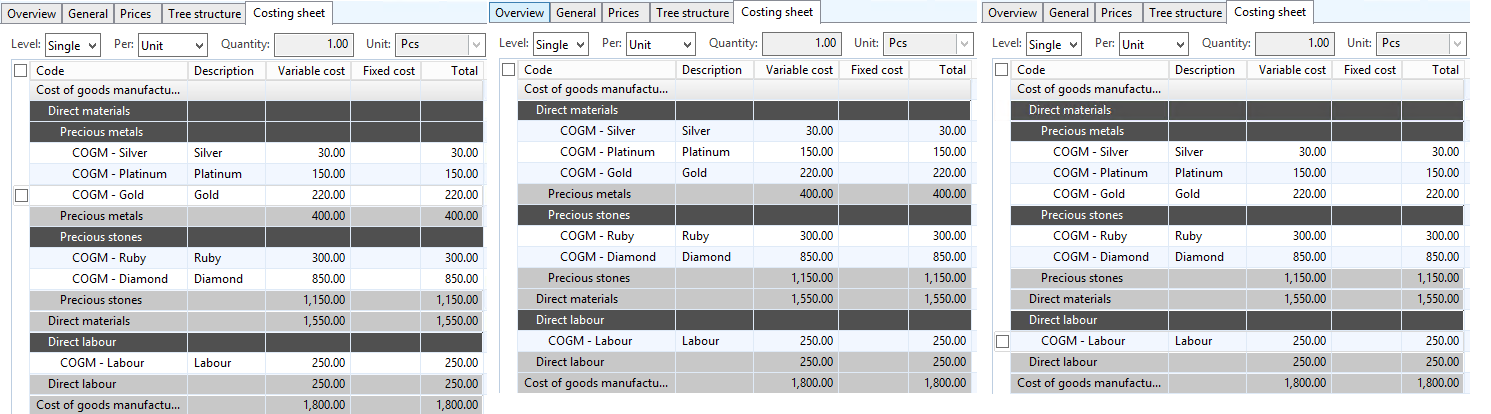
Now, when we navigate back to the details of BOM calculation on the costing sheet tab, we can see the detailed classification of our costs. First of all, we can see that $1550 are coming from the direct materials consumption. Furthermore, out of those $1550, $400 come from precious metals usage, while the rest is coming from the usage of precious stones.
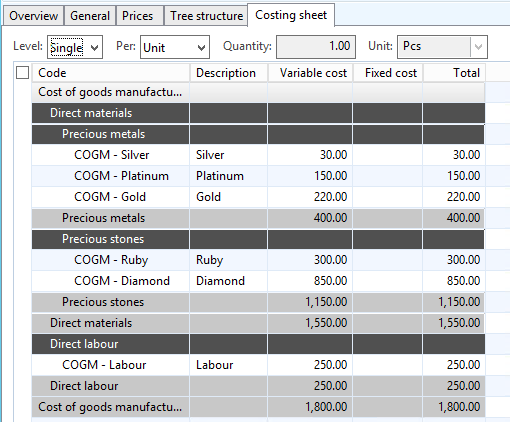
Ken can now easily understand the structure of costs. After a quick glance at the costing sheet, he knows that precious metals contribute to less than 25% of the total cost of the finished good. He can now make a meaningful assessment of consequences of rising precious metals prices.
Two words about the “Header” and “Total”
You may have wondered what the settings “Header” and “Total” on the costing sheet node do.

The “Header” checkbox controls whether the header row should be displayed on the “Costing sheet” tab. Respectively, the “Total” tab controls if the total row should be displayed for a given node. In the following example, the header and total settings have been modified for the “Precious stones” group.
What’s next?
In the upcoming posts, we will cover how to use costing sheet to define and calculate indirect costs. Stay tuned.