Information Access – Reporting in Dynamics AX
Dynamics AX '7'
Why is this important?
Information access is an essential part of an ERP solution and represents a significant portion of the user engagement with the system. Consider the numerous methods of capturing information related to daily activities and the level of investments required to manage the data. Employees depend on logical interpretations of massive amounts of data to stay on top of their daily tasks. The AX platform provides a collection of reporting solutions out-of-the-box to address the various information access needs of an ERP solution.
In an increasingly competitive environment, mergers and acquisitions seem to occur as often as the change in seasons. More than ever before, businesses today are finding ways to expand their global reach to attract more customers. To be successful, they must adapt legacy solutions used to communicate with customers and prepare for the enforcement of regional regulatory requirements associated with new markets. Beyond the primitives functions provided by Azure - compute, networking, storage, and authentication – the Dynamics AX platform provides tools to manage resources for organizations that span in size from small businesses to global enterprise conglomerates. These tools are designed with flexibility in mind to accommodate a dynamic world of business.
What is a “Report” in Dynamics AX?
A report can be defined simply as a structured presentation of data. Under ideal circumstances reports materialize data in such a way that it allows the user to make informed decisions. Dynamics AX supports a broad spectrum of information access scenarios: cross company all-up financial reporting; analytical dashboards & tiles; electronically transferable funds; customer sales invoices; checks & tax documents; and many more.
Examples of integrated report scenarios involving the consumption of business data
- Native controls including list pages, grid controls, and chart visualizations
- Dashboards and Workspaces containing predefined and personalized views
- Financial reporting providing all-up views across legal entities
- Structured documents distributed internally to employees or externally to customers & vendors.
Although, each of these scenarios at its core involves the presentation of structured business data, the process of accessing these reports and how the results are subsequently consumed varies greatly. Flexibility in the user tooling is essential for scenarios that involve data exploration. By contrast, layout precision is mandatory for compliance with most regulatory documents. Given the diversity of information access scenarios it’s understandable that not all reports are created equal. And, this guide is intended to help familiarize the reader with the various reporting options available as part of the Dynamics AX platform.
Common “Myths” of Reporting
To become a proficient report maker, it’s often useful to let go of past inhibitions. The following section seeks to rebuke three common “myths” about reporting.
Myth #1: Operational reports require "real-time" data
To the contrary, there are relatively few reporting scenarios that require real-time results. And, in the grand scheme of things, taking a critical stance on a request for real-time views is recommended given the high development costs and potential heavy burden these solutions may incur on production environments.
Myth #2: The best tool is the one the developer is most comfortable using
Consider a customer request for a report that allows them to monitor company's assets. In the past, a developer would build a static report displaying a list of inventory items with complex calculations relying entirely upon the user to provide filters to sufficiently reduce the result set. This solution may function perfectly in developer environments with a reduced data set. However, this approach is prone to consume significant amounts of compute resources unnecessarily when utilized in production.
Myth #3: Developers are good at creating visually compelling designs
In reality, developers are the often the worst offenders when it comes to producing elegant design layouts that will appeal to the customer's aesthetic preferences. When it comes to analytical reports you’re better off empowering users to both explore the data directly and share personalized views.
Understanding report requirements
The best reporting solutions are designed with the expertise, daily functions, and information access needs of the target user in mind. Dynamics AX platform offers several tools designed to meet the functional requirements which are common across various reporting experiences. Without question, selecting the right tool that most effectively addresses the need requires a clear understanding of the customer experience. You can drastically increase your chances of delivering a complete & robust solution that fully satisfies customer requirements by simply asking the right questions.
Here are some leading questions to ask when evaluating customer requirements for reporting solutions:
- Get to know the user
- What is the proficiency of the target persona? Are they familiar with analytical tools like Excel?
- Does the user require a guided parameter experience to refine the dataset?
- How frequently will the report be accessed?
- Familiarize yourself with the data
- Are they looking for transactional, analytical, and/or predictive information?
- Does the shape of the data change and if so, how often?
- Will the report include data from external sources?
- Determine how the results will be used
- Are you going to explore the data to gain insights?
- How will the results be shared with others?
- Is there a fixed document structure for the target output?
It’s understandable that customers want a solution that aligns with the existing processes they are comfortable using. However, there’s a lot you can learn through these leading questions used to discover what the customer actually needs to be successful in their task. Delight your customers by providing them with solutions that empower them to be more productive.
Reporting experiences in Dynamics AX
Information access scenarios supported in Dynamics AX applications can be broken down into five distinct reporting experiences. Specialized tools are provided to meet the complex and diverse reporting needs of various functions throughout the organization.
- Operational views – designed to address the specific needs of a given business persona
- Business documents – static documents used to capture and exchange processed business data
- Analytical tools and visualizations – personalized presentations of logical calculations that allow the user to explore their data
- Electronic reporting – tool used to configure formats for electronic documents
- Financial reporting – designed to provide in-depth accounting management tools based on standard views of financial activities across legal entities
SCORECARD
The following table can be used as a guide when choosing the right tool for the reporting solution.
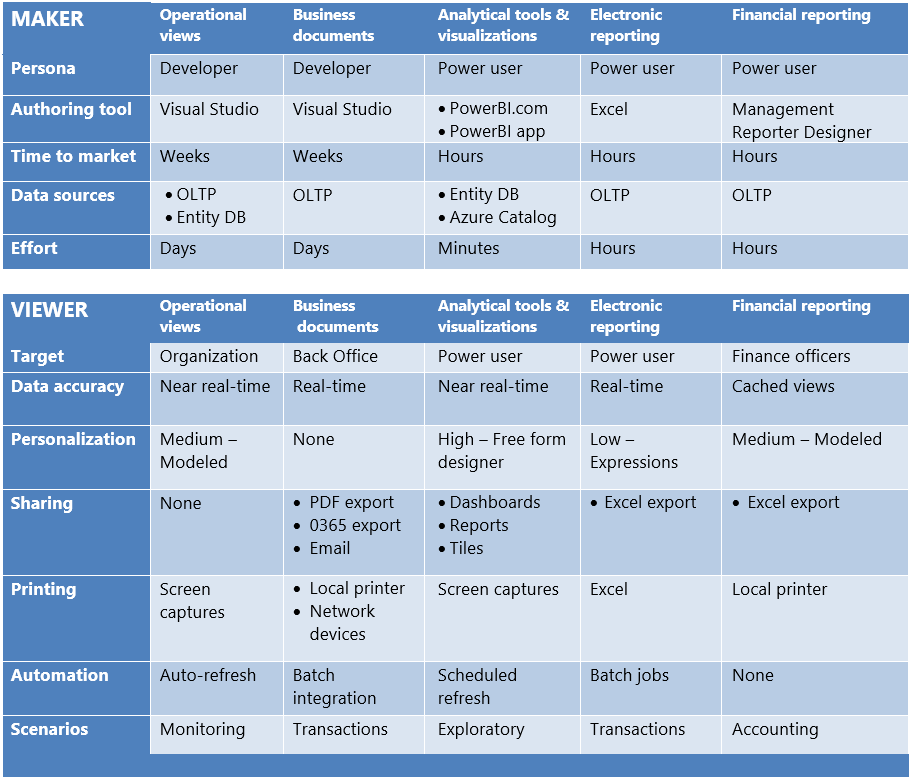
Note: “Near real-time” denotes processed data that is slightly slower than real-time
Operational views
Operational views represent an essential part of the average employee’s daily life. As important as a brush is to a painter, operational views are used to empower people to be productive. These views contain logical presentations of data to help the user discover patterns, highlight anomalies, and take action on the most important tasks. Targeted experiences are used to satisfy the unique information access requirements for a given persona. These views provide actionable controls that help to maximize efficiency for common user actions. Learn more about constructing custom operational workspaces here - https://ax.help.dynamics.com/en/wiki/building-operational-workspaces/.
Example applications of electronic reporting include: Controller operations, Production floor management, and Customer collections monitoring 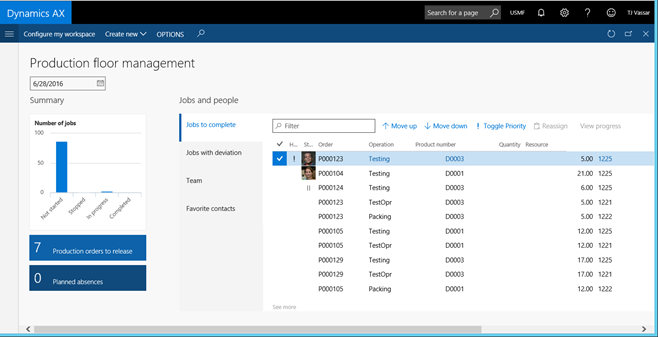
What are the characteristics & capabilities?
- A fully integrated experience with responsive visualizations fully aware of user context and selections
- Views can be personalized to a large extent to meet the unique desires of the user which are prone to change
- Actionable controls allow the user to efficiently transact and monitor activities
- Combination of analytical data to help answer general questions and transactional views to access record details
What distinguishes ‘Operational views’ from other types of visualizations?
- General purpose tools designed to be utilized at all levels of the organization
- Pre-defined views are provided based on common information access requirements associated with a specific role within the organization
- Highly responsive to user interactions and changes made to the transactional database
What’s important to consider when selecting this tool for the job?
- The platform allows users to embed Power BI tiles and links to reports directly in workspaces
- Users can introduce personalized workspaces to create their own custom operational views
- Form data sources now support aggregate queries for analytical views using native controls
Analytical tools and visualizations
Embedded visuals based on analytical data allow users to navigate between aggregate views down to the transactional details that affect them. PowerBI service integration in Dynamics AX delivers world-class analytical tools with built-in support for accessing data. These tools empower ‘citizen developers’ to author the reports they need and share them with others within the organization. Use the Power BI Report Packs available on on LCS to help get you started. Learn more about Power BI integration here - https://ax.help.dynamics.com/en/wiki/powerbi-integration-in-ax7/
Example applications of electronic reporting include: Customer sales per quarter, total revenue by region, and inventory turn-over 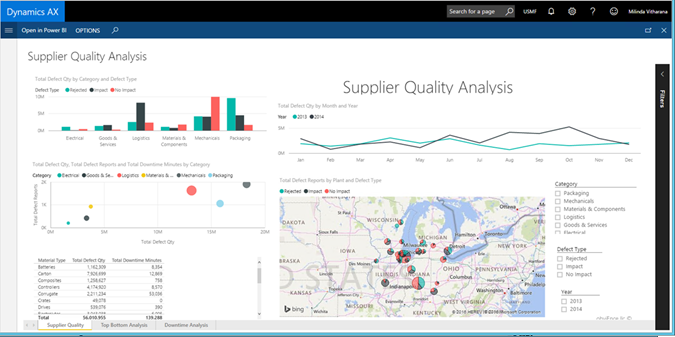
What are the characteristics & capabilities?
- Near-real time results that provide macro level insights based on micro level activities
- Common applications include charts, KPIs, and more complex visuals
- Offer a deep exploratory experience with interactive controls that provide drill-thru navigations
What distinguishes ‘Analytical tools and visualizations’ from other types of reports?
- Highly graphical in nature, these presentations are used to find the hidden meaning behind the data
- Free form web designer that supports rich visualizations with built-in user interactions
- Utilized by power users to explore data and gain insight through analysis
- Personal in nature by allowing the user to choose which information to include
- Built-in sharing capabilities and user controlled access management
What’s important to consider when selecting this tool for the job?
- Developers are responsible for publishing data entities that can be consumed by Power BI
- Power users can produce mash-up views based on AX data combined with external data sources
- Visuals are highly responsive to user interactions and provide near real-time results when using Direct Query access to the data source
Business documents
These reporting solutions are often used to capture and communicate the details of business transactions. As such, this requires a reporting solution capable of producing physical manifestations of business data using existing devices like network printers. Learn more about the enhancements to the Document reporting service here - https://ax.help.dynamics.com/en/wiki/document-reporting-services/.
Example applications of Business documents include: Sales invoice, Customer statements, and Checks 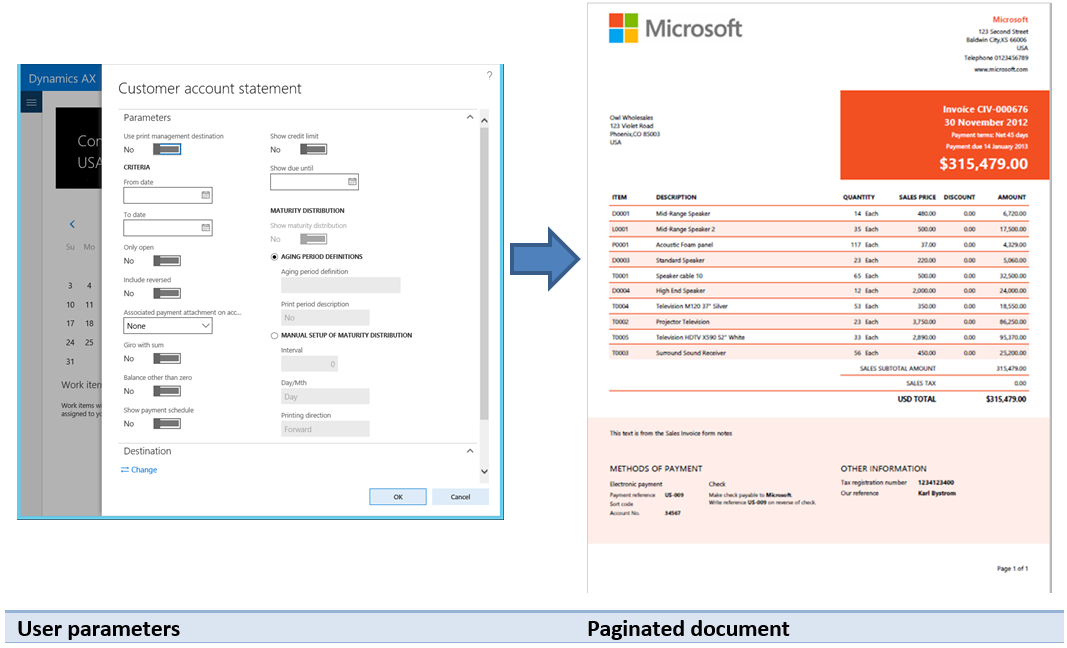
What are the characteristics & capabilities?
- Paginated documents that are ultimately destined to be printed on paper or distributed via email
- Heavily dependent on parameters to filter and produce the desired result set
- Business documents capture a snap-shot of customer & vendor activity which can be archived for future reference
- The complex solutions are developed in Visual Studio and deployed as part of the application
What distinguishes ‘Business documents’ from other types of visualizations?
- Asynchronous data access and rendering solution designed to handle relatively large data sets
- Dedicated reporting services offers distributed resource utilization
- Ideal solution for automated processes that involve bulk generation of business documents
- Includes built-in support for document archive and data extraction via file export to PDF in addition to Word, Excel, and CSV
What’s important to consider when selecting this tool for the job?
- Application Suite reports are intended to be used as a starting point for custom solutions
- Solutions are heavily dependent on meta data changes and do NOT offer personalization
- Modifications to out-of-box solutions must be managed as a metadata change
Electronic reporting
Electronic reporting (ER) is the tool to use to configure electronic document formats in accordance with the legal requirements of various countries/regions. For more information about the Electronic reporting tool including application scenarios visit here - https://ax.help.dynamics.com/en/wiki/general-electronic-reporting-ger/.
Example applications of electronic reporting include: Financial auditing, Tax reporting, and Electronic invoicing 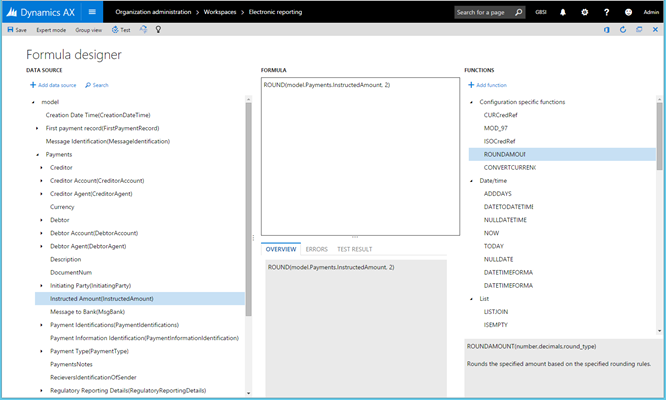
What are the characteristics & capabilities?
- Perfect tool for producing TEXT, XML, and OPENXML worksheet formats
- Tooling is designed for business users familiar with Excel based formulas
- Highly adaptable to adhere to changes in regulatory requirements
- Component versioning is available to manage draft definitions
What distinguishes ‘Electronic reports’ from other types of visualizations?
- Designed for electronic submission to banks, governments, and other external entities
- Use formulas to define data transformations into groups containing summary data and logical calculations
Financial reporting
Standard financial reports are provided using the default main account categories in Microsoft Dynamics AX. Use the report designer to create or modify traditional financial statements, such as Income statement and Balance sheet and share the results with others members of your organization. Detailed information on the Financial reporting tooling is available here - https://ax.help.dynamics.com/en/wiki/financial-reporting/.
Example applications of electronic reporting include: Balance sheets, Cash flow, and Summary trial balance year over year 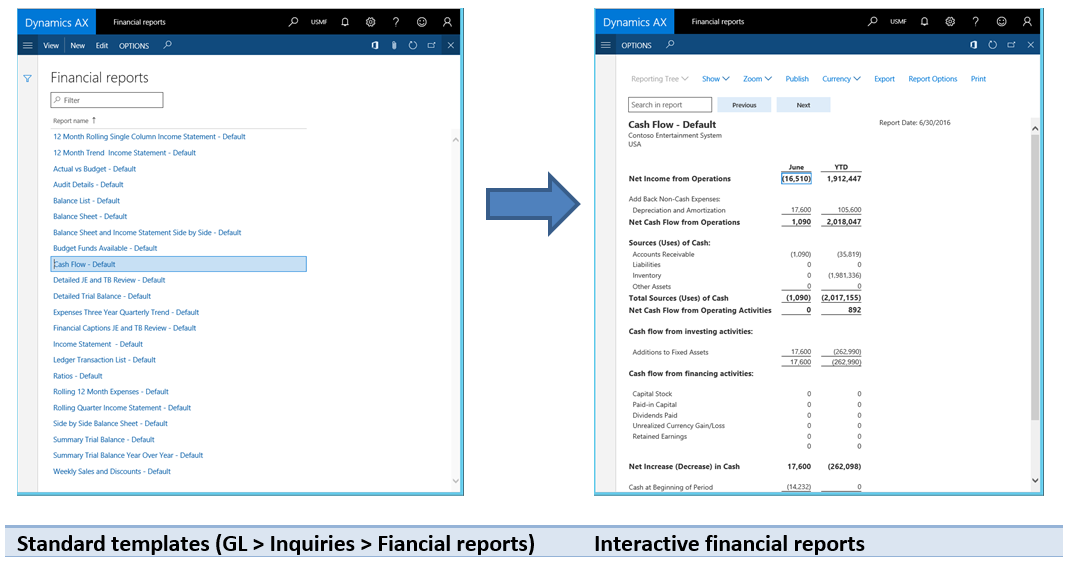
What are the characteristics & capabilities?
- Built-in flexible financial reporting solution designed to handle complex organizational structures
- Fully integrated with the Dynamics AX General Ledger
- Create custom financial reports using the default solutions as a starting point
- Interactive reports with drill-down capabilities to navigate down to transaction details
What distinguishes ‘Financial reports’ from other types of visualizations?
- User controls are tailored for the specialized needs of financial reporting
- Create roll-up reports containing data across companies or business units
- Utilizees a Financial data mart for optimized performance