Pinning Power BI reports to Dynamics AX client
This is the third bog post on May update enhancements for Dynamics AX. In the first post we discussed Entity store in detail: https://blogs.msdn.microsoft.com/dynamicsaxbi/2016/06/09/power-bi-integration-with-entity-store-in-dynamics-ax-7-may-update/
In our second blog post we discussed end-to end reporting lifecycle with Power BI reports. In this post, we will see how your users can pin Power BI tiles and Reports into their AX workspaces.
As we discussed earlier, we are making the Power BI integration feature much stronger with Entity store. There are several features that will enable great E2E PowerBI reporting experiences in Dynamics AX. You can see a list of features here: https://ax.help.dynamics.com/en/wiki/whats-new-or-changed-in-dynamics-ax-7/#may-2016-platform-features (scroll down to the Analytics area)
It’s worth spending a few minutes discussing the rationale behind out investments. In short, the gaining importance of Power BI as a reporting option in AX.
Data exploration with Power BI
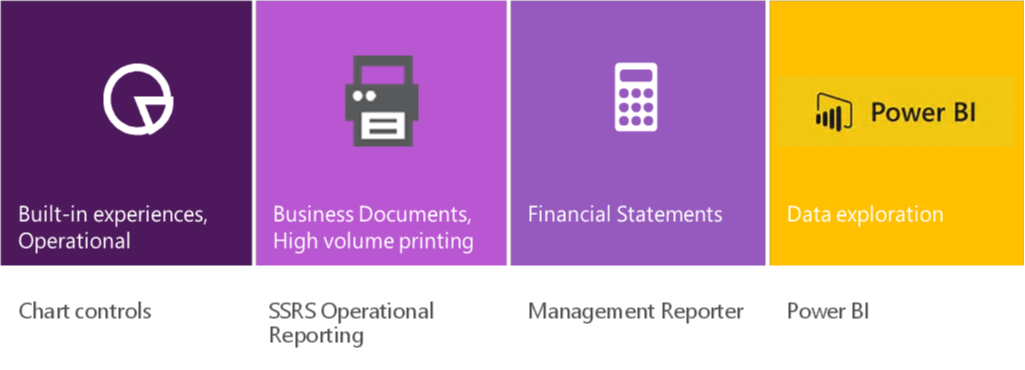
There are 4 flavors of reporting in Dynamics AX.
Chart controls are used for building embedded experiences that require visuals. SSRS is an engine designed for pixel-perfect, formatted reports that often require printing. We leverage SSRS for document style reports such as Invoices and Purchase Orders. While SSRS Reports migrated from AX2012R3 would continue to work in Dynamics AX, our investments on SSRS integration will focus on document generation and printing scenarios. For all non-document reports or reports that don't need to be printed, we want to embrace Power BI.
We have used the word "self-service reports" or "Ad-hoc reports" in the past when referring to Power BI. We will use the word "data exploration" in the future. There's a subtle shift in paradigms hidden behind this change of name. Self-service reports were reports that the users themselves created (or a power user created it and shared with others, who continued to tweak it to their needs). Often, users need to change the shape of a chart, add a new column, change the grouping or simply create a new view of data. While we could think of it as a report, as a user you are trying to understand the data, exploring it, pivoting it around columns, changing the shape of charts. Technologies of the past didn't allow exploring large volumes of data interactively. So users had to resort to creating "reports" - many views of the same data.
With Power BI (and many thanks to in-memory database technologies in SQL Server), a report is a just the starting point for interactive data exploration. Charts in a Power BI report beg to be clicked, visuals change shape interactively and data can be filtered with ease. Users can tweak existing reports with ease and create their own views of the data. The reports can be shared and teams can collaborate over data.
So while there is a "thing" called a Power BI report, we are broadening the definition recognizing the larger scenario at play. Your users are exploring data with Power BI!
Pin Power BI tiles to workspaces
I assume you are familiar with the feature we introduced with Dynamics AX where you could pin a Power BI tile into a workspace. You can read more about the feature here: https://ax.help.dynamics.com/en/wiki/powerbi-integration-in-ax7/#embedding-power-bi-visuals-in-the-dynamics-ax-client
If you are a developer creating a workspace, you can enable users to pin Power BI tiles into workspaces by embedding the Power BI tile control.
Pin Power BI reports to workspaces
May-2016 update introduces the ability to pin Power BI reports into a workspace. In fact, PowerBI reports can be added to any workspace that contains the Links section – which is to say that Reports can be added to almost all workspace that are shipped in the product.
In order to enable Power BI reports and tiles, you need to configure Power BI with AX – this is a one time operation that needs to be performed by an administrator in an AX environment using the steps described here: https://ax.help.dynamics.com/en/wiki/configuring-powerbi-integration/#register-your-dynamics-ax-deployment-as-a-web-app-in-the-azure-portal
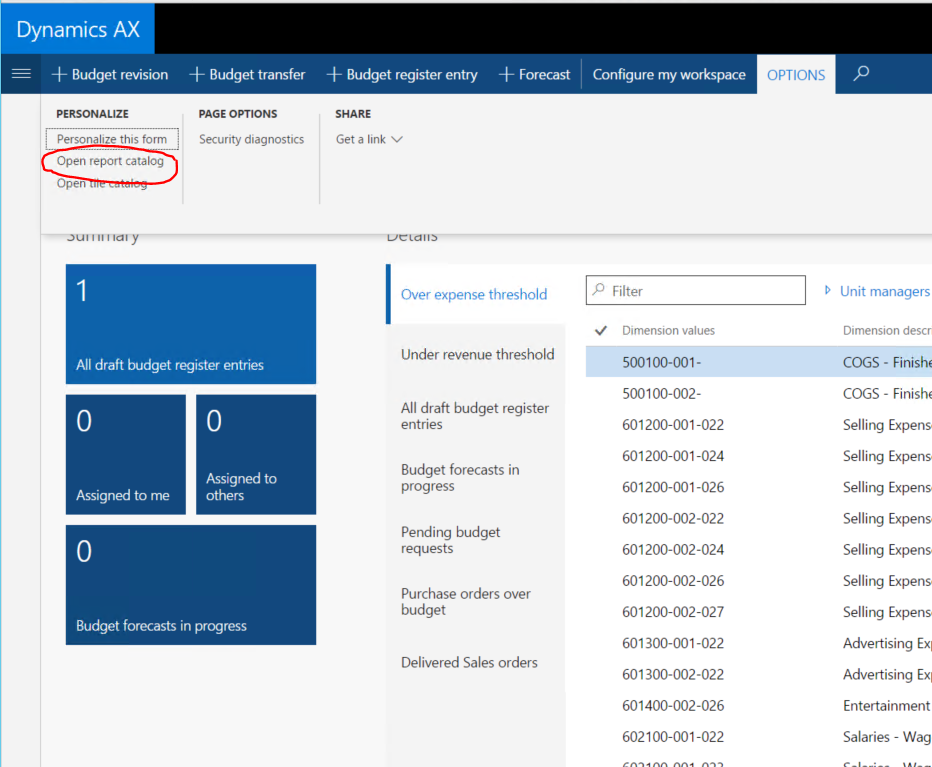
Now that you have configured Power BI with Dynamics AX, let’s launch the Ledger Budgets and forecasts workspace from AX client.
Select the OPTIONS menu from the top. Notice that the Options menu contains links to launch the (Power BI) tile catalog and the (Power BI) report catalog. Select the report catalog and a dialog box with a list of reports will be displayed as shown below.
The list of reports shown here comes from the reports that you have in your Power BI account. Launch PowerBI.com and you will see the same list of reports used across your PowerBI dashboards.
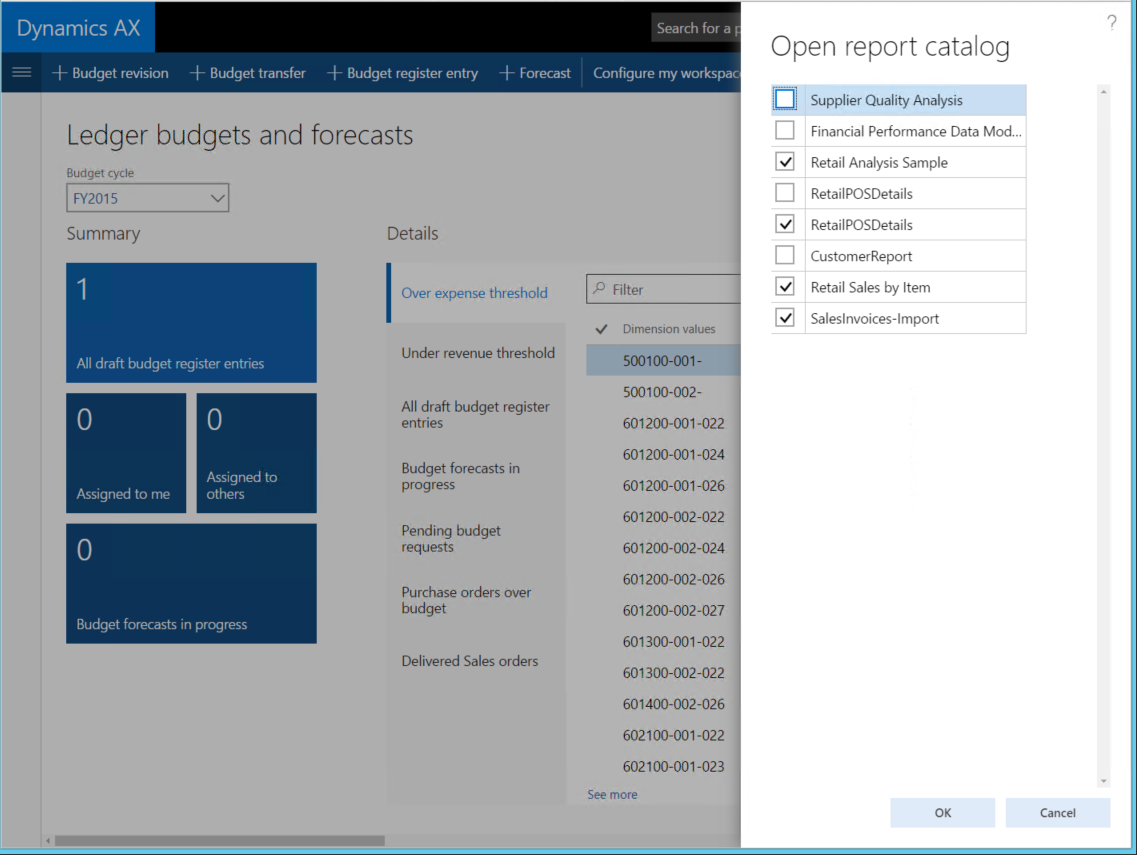
Select a few reports as shown above and select OK button to continue. Next, scroll to the links section in your workspace and go to the bottom of the list. You will notice that a new section has been added to your links with Power BI reports.
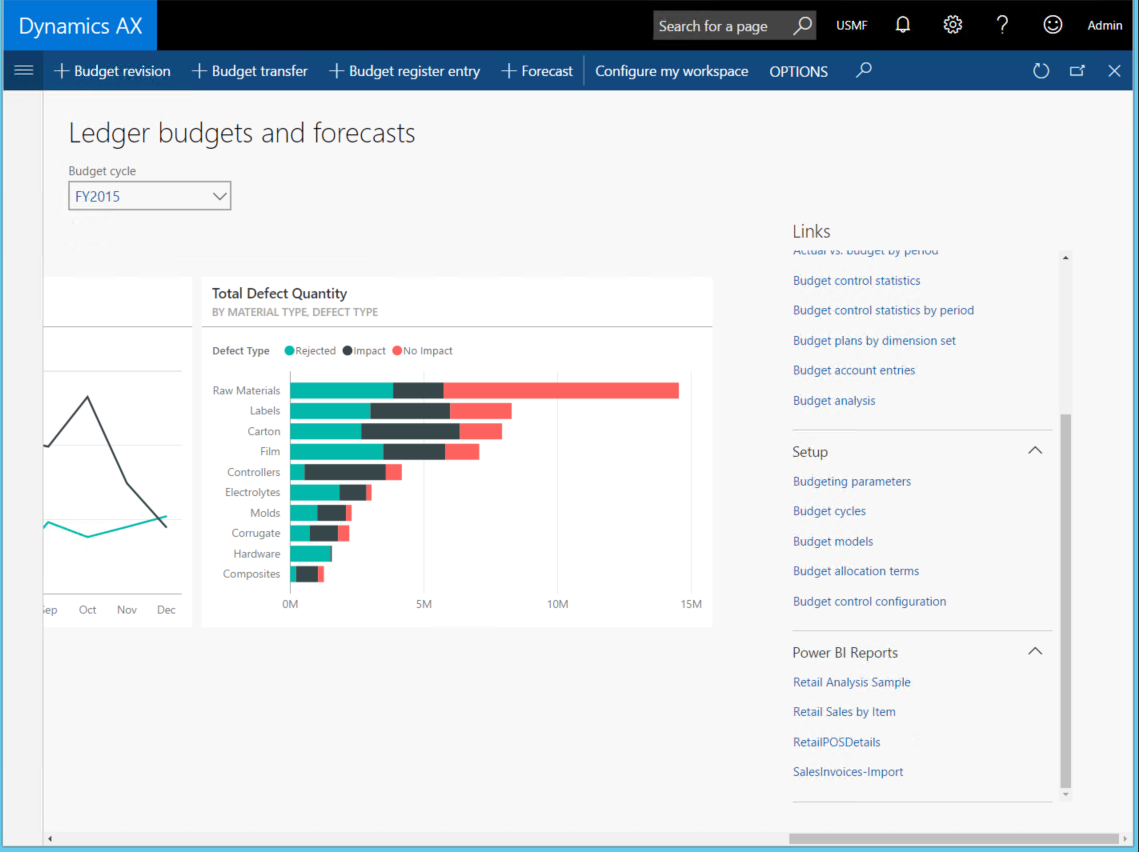
Full page Power BI reports in AX client
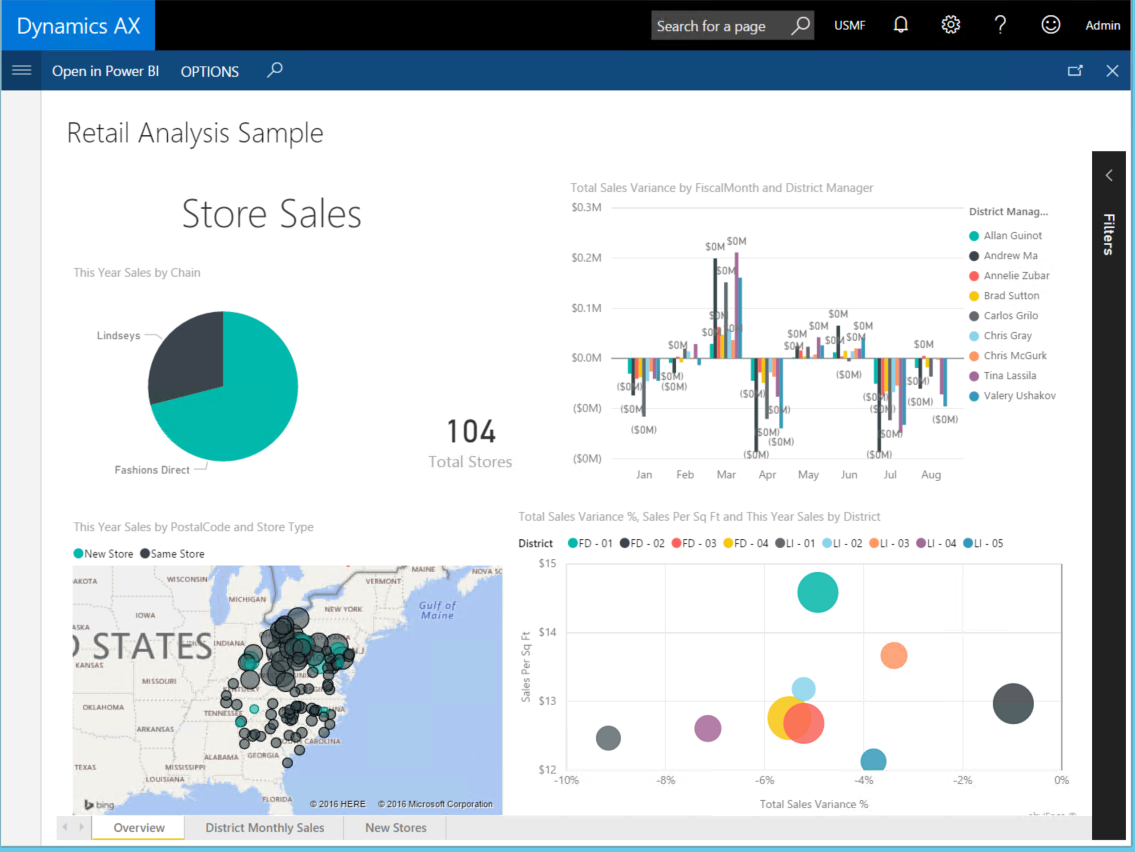
A power BI report can be launched and run within AX client similar to an SSRS report. To see this in action, click a Power BI report link. In this case we will click the Retail Analysis Sample report.
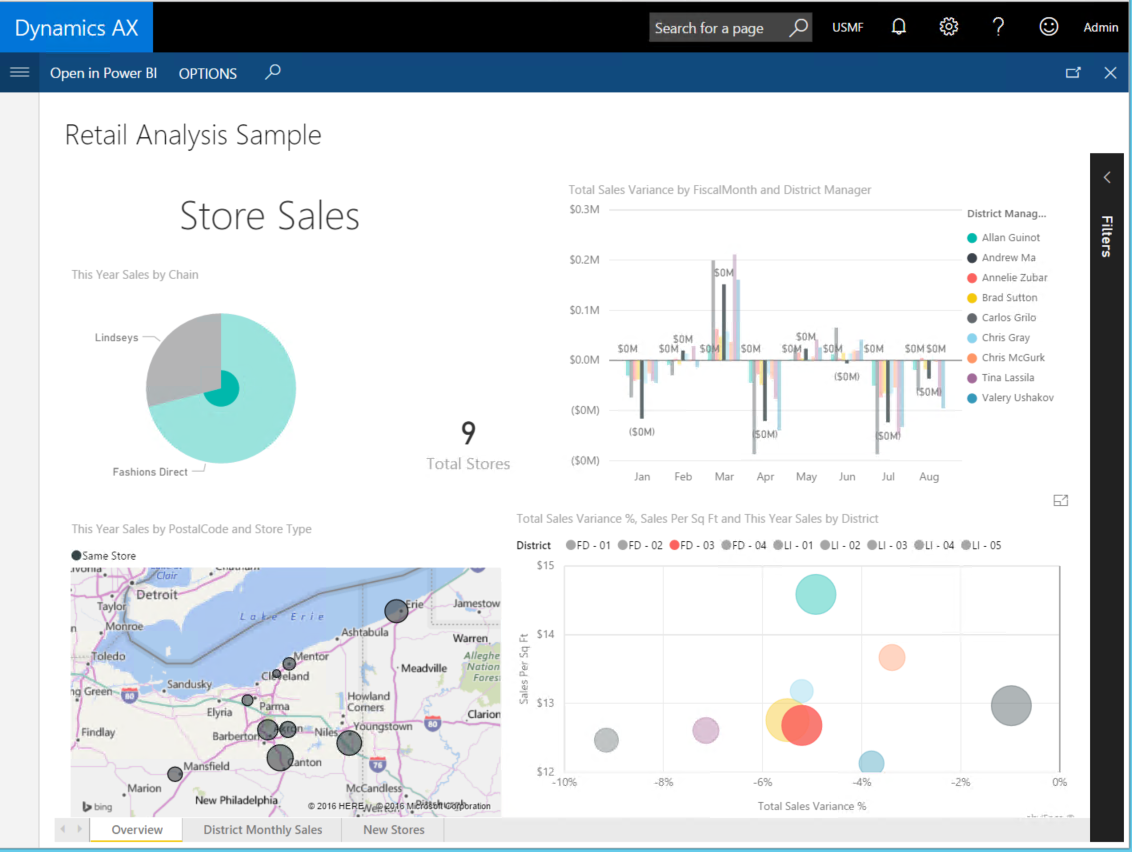
Power BI report will be launched in a full screen within AX client as shown below. The report is interactive – you can click regions of the report and the rest of the visuals react to the report selection. You can also filter data within the report using the filter pane.
You can also launch this report in PowerBI.com and make any changes. The resulting report can be saved as another copy with a different name – and you can pin that one as well.
Power BI in user created workspaces
So far we discussed adding Power BI tiles and reports to “developer created” workspaces. That is, workspaces created either by Microsoft (ie. built into the product) of the workspaces created by your ISV/partner or in-house developers.
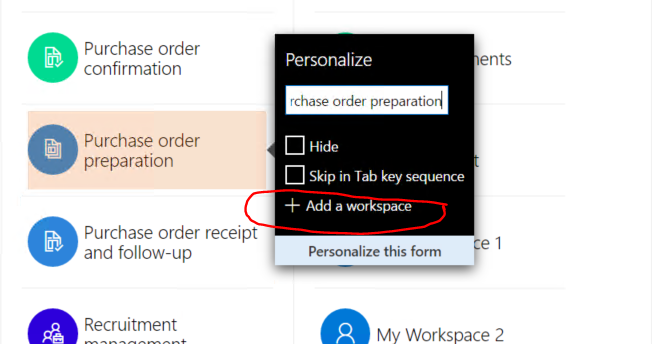
In May-2016 update, a user can create a new workspace using the personalization capabilities of AX client. To create a new workspace, navigate to the AX home page (or the dashboard) and right click on a workspace tile. Select the Add a workspace option.
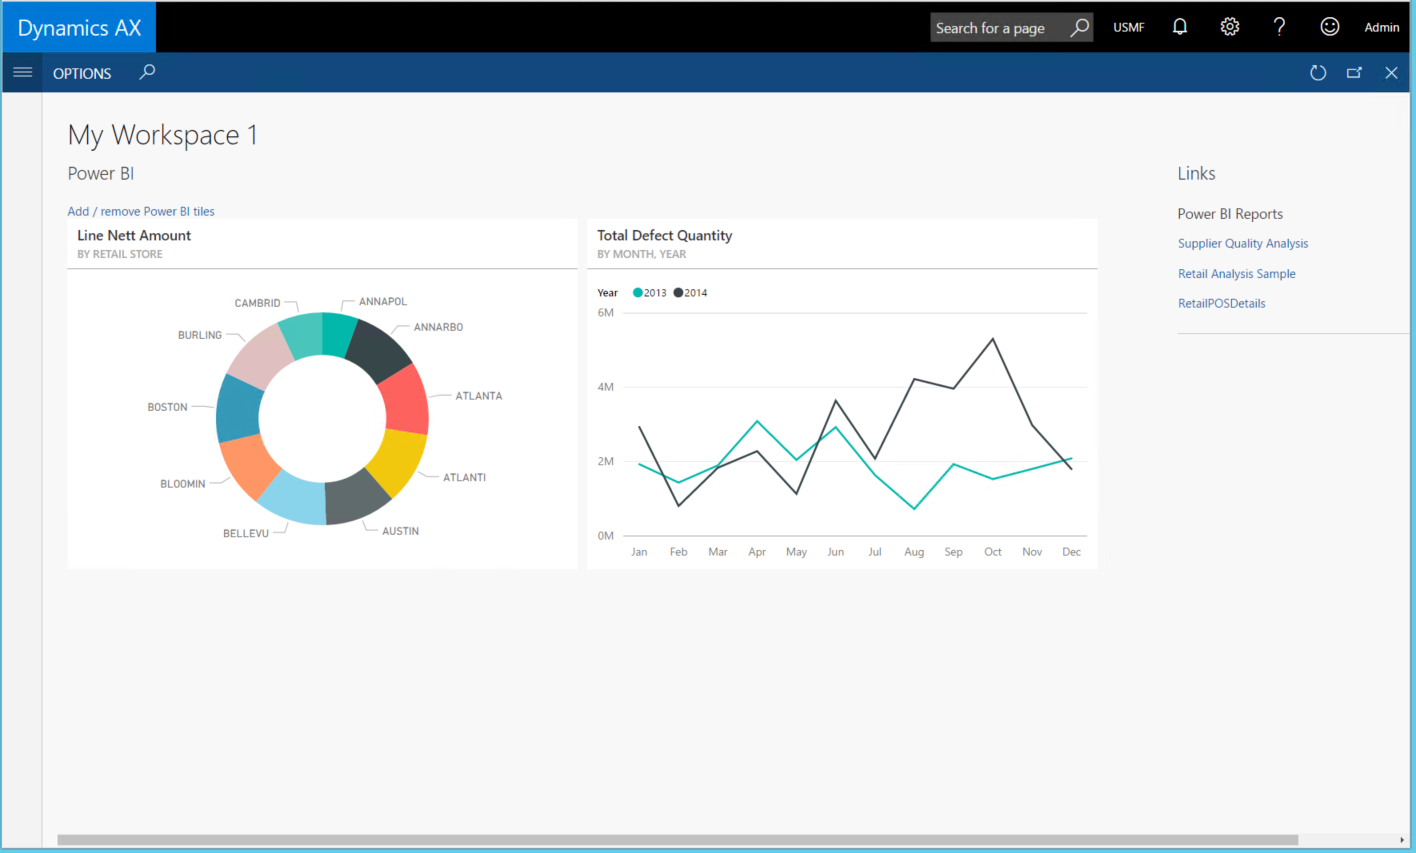
A new workspace will be created for you. Newly created workspaces are names My workspace 1, My workspace 2 and so on. You can change the name later of course.
Click My workspace 1 and you can add PowerBI tiles and reports using the same options we discussed earlier.
What this means…
Now that you have an overview of end-to end Power BI integration in May-2016 update, Let’s take a step back and think thru the possibilities;
- As a power user you have the ability to create Operational reports with Power BI desktop using AX Data in Entity store
- Not only are these reports rich and interactive, you can empower your users to make changes without relying on another person (or bugging you!)
- Power BI reports can be embedded in AX client and your users can pin them to workspaces, along with charts and document reports. They can pin the relevant reports themselves
- If you are a partner or an ISV, you can ship Power BI reports are part of your solution. You can share them with your customers
- As an ISV you can ship “reports packs” as updates. You can ship them frequently and iterate over them in a very agile manner.
I hope you are as excited as we are. We look forward to lot of beautiful operational reports in AX