Using column restrictions to improve your report presentation
A well designed report will clearly describe the information that is important on the report and help report viewers to quickly understand the data. If there is a lot of data on the report, it can seem overwhelming to get an overview and know where to focus your attention.
Using column restrictions within the Row Definition allows you to quickly scan the report to see both the details and totals.
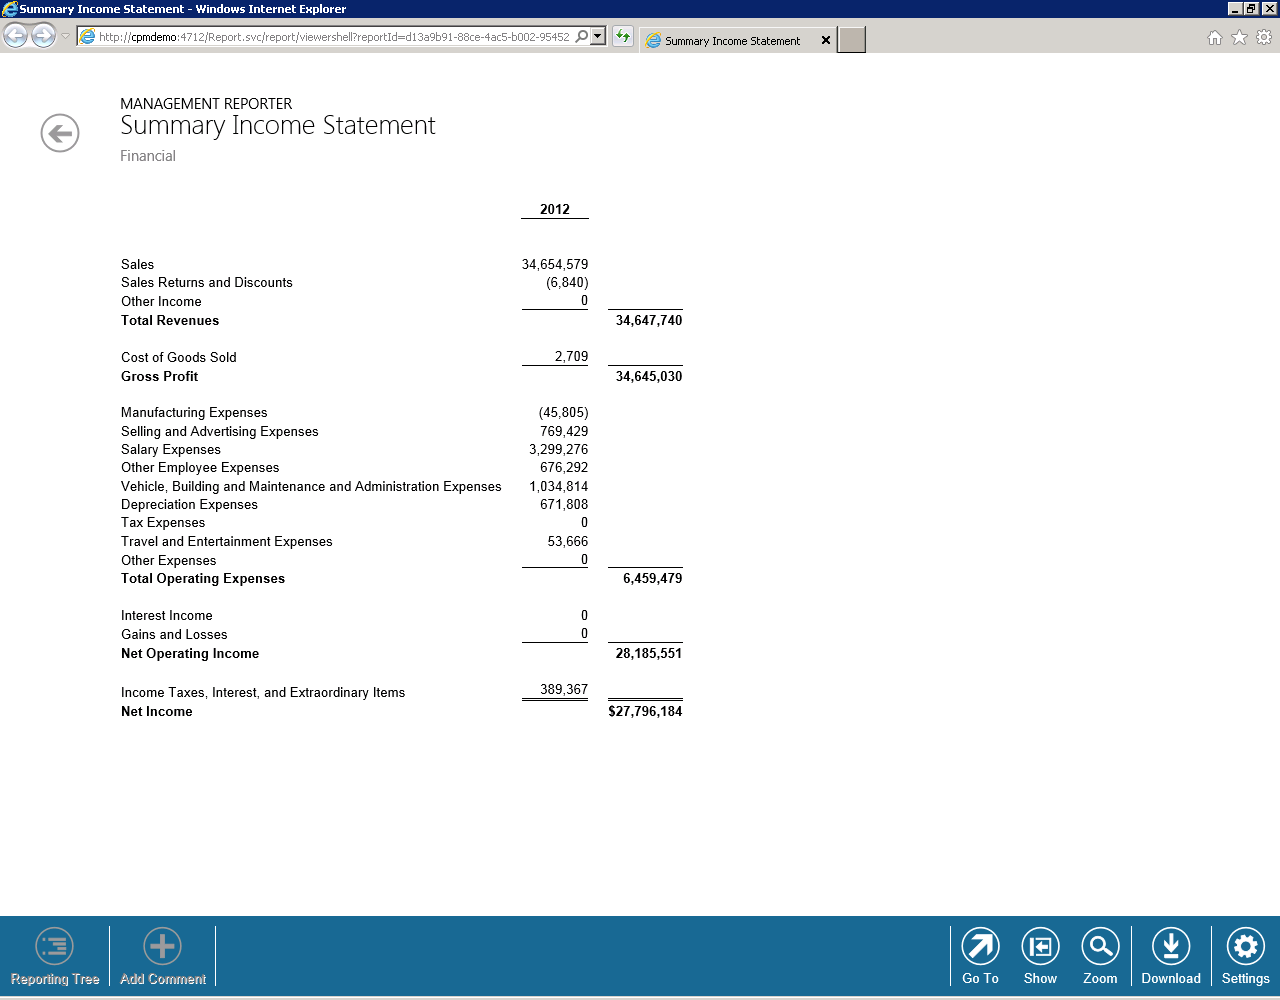
For this example, any account detail lines will be in the first column (column B) while any subtotal and total lines will be in the second column (column C). This will show subtotals in a separate column from the detail. The setup is done using these simple steps:
1. For each period of data in your report, you will need two FD amount columns in the Column Definition The first will be used for the account detail and the second for the subtotals and totals. Make note of the specific column letter for each of your FD columns.In the example in the video, the detail will be in column B and the totals in column C.
2. In the Row Definition, update the Column Restriction field (column H). Type in the corresponding column letter that you had recorded from step one. You can enter in multiple values separated by commas.
3. Once these steps have been completed, generate the report.
Column restrictions are one of many great tools in Management Reporter to improve the visual presentation of your reports.
Watch the video below for more detailed information.
[embed]https://www.youtube.com/watch?v=Pc_RccJvy7c&feature=youtu.be[/embed]