Getting Started with a New Report - Row Definition Basics
Management Reporter uses building blocks to make sure that your reports can reuse existing rows, columns, and trees rather than creating unique ones per report. There are a few concepts that can help you when building a new report to help reduce the need for maintenance and increase reusability. When creating a new report, often the Row Definition is the building block that requires the most effort. To create a new Row Definition you have to add in all of the details for your accounts and dimensions, you need to add some formulas like totals and subtotals, and you will need to apply some formatting as well. Here are six tips specific to Row Definitions to consider when you need a new report.
Tip #1 is to consider using the default reports as a starting point. There is an existing balance sheet, statement of cash flow, and income statement design that can be used as the basis for many different reports. All of the time consuming work has been done for you. Just personalize to your organization and make sure account categories have been assigned to your accounts.
Tip #2 is to avoid using full accounts, such as 41100-100-130 to define the account, cost center, and dimension. Instead, just use 41100, unless you need to ensure some departments and cost centers are used for specific rows. Going a step further here, also consider using wildcards, such as * or ?. 41* will return all accounts starting in 41, while 41??0 will return all 5 digit account numbers starting with 41 and ending in zero. Use the wildcards whenever possible so you don't have to manually add new accounts to your Row Definitions.
Tip #3 is to build something reusable. Building reports using account categories is a step in the right direction, but if you need something more granular, you can use dimension value sets to create your own logical groupings of accounts or dimension values.
Tip #4 is to consider using the summary detail view in the web viewer to collapse a detail report into summary. This can replace the need for maintaining both a summary and detail version of the same report.
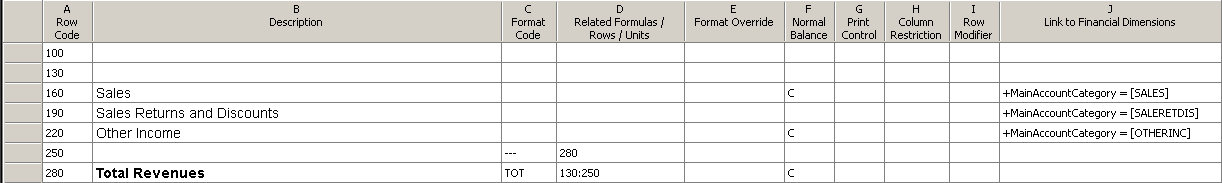
Tip #5 is to pad your total calculations to allow for newly creating accounts. In the below screenshot, the Total Revenue calculation includes everything between row 130 and row 250. If a new row is inserted above the first account or below the last account, the total formula will automatically include those new accounts.
Tip #6 is use the Related Formulas / Rows / Units column to associate formatting rows like description and underscores to your subtotal row. Using this with the setting in the Report Definition to display rows with no amounts unchecked will suppress that detail if there is no data. If your IT department doesn't generate any revenue, this will suppress the revenue section from displaying in the viewer. You can see this in the screenshot below for row 250.
Note: Click on the image to see a larger version of the Row Definition.