Build detail reports quickly using Insert Rows from Dimensions
Reports that break out your financial details into logical groupings like accounts or dimensions are very powerful. This type of report can let you see the detail for your entire organization by browsing through a list of values. This type of detail can be viewed through either drilling into a summary report, or by building out a detailed report line-by-line.
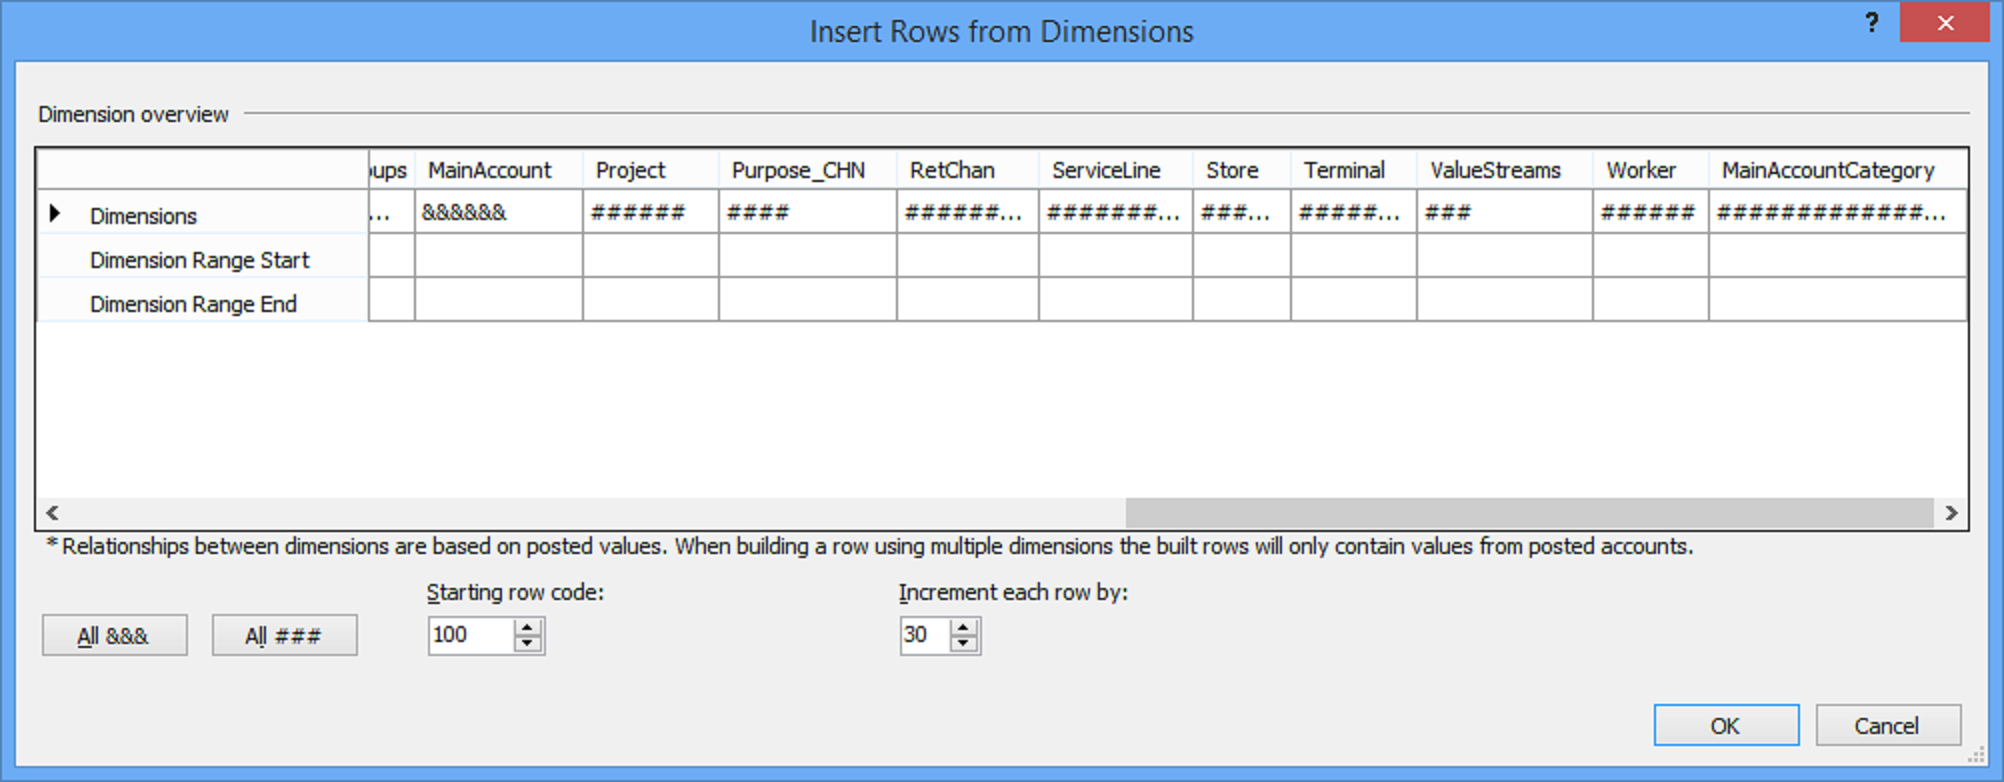
For this post, we will look at the example of building out a detailed report. Building a report line-by-line is actually easier than you may think. There is feature you may have used, but not realized its full capabilities. Within the Row Definition, you can click into Edit, then Insert Rows from Dimensions. This window allows you to insert the values from your main account, or any of your financial dimensions into the report and automatically populate all of the descriptions for those rows as well as the values. What you may not know is that you can use this window multiple times. This can be done to insert subsections of your entire chart of accounts in an organized fashion into your report.
(Click on image above for a larger view)
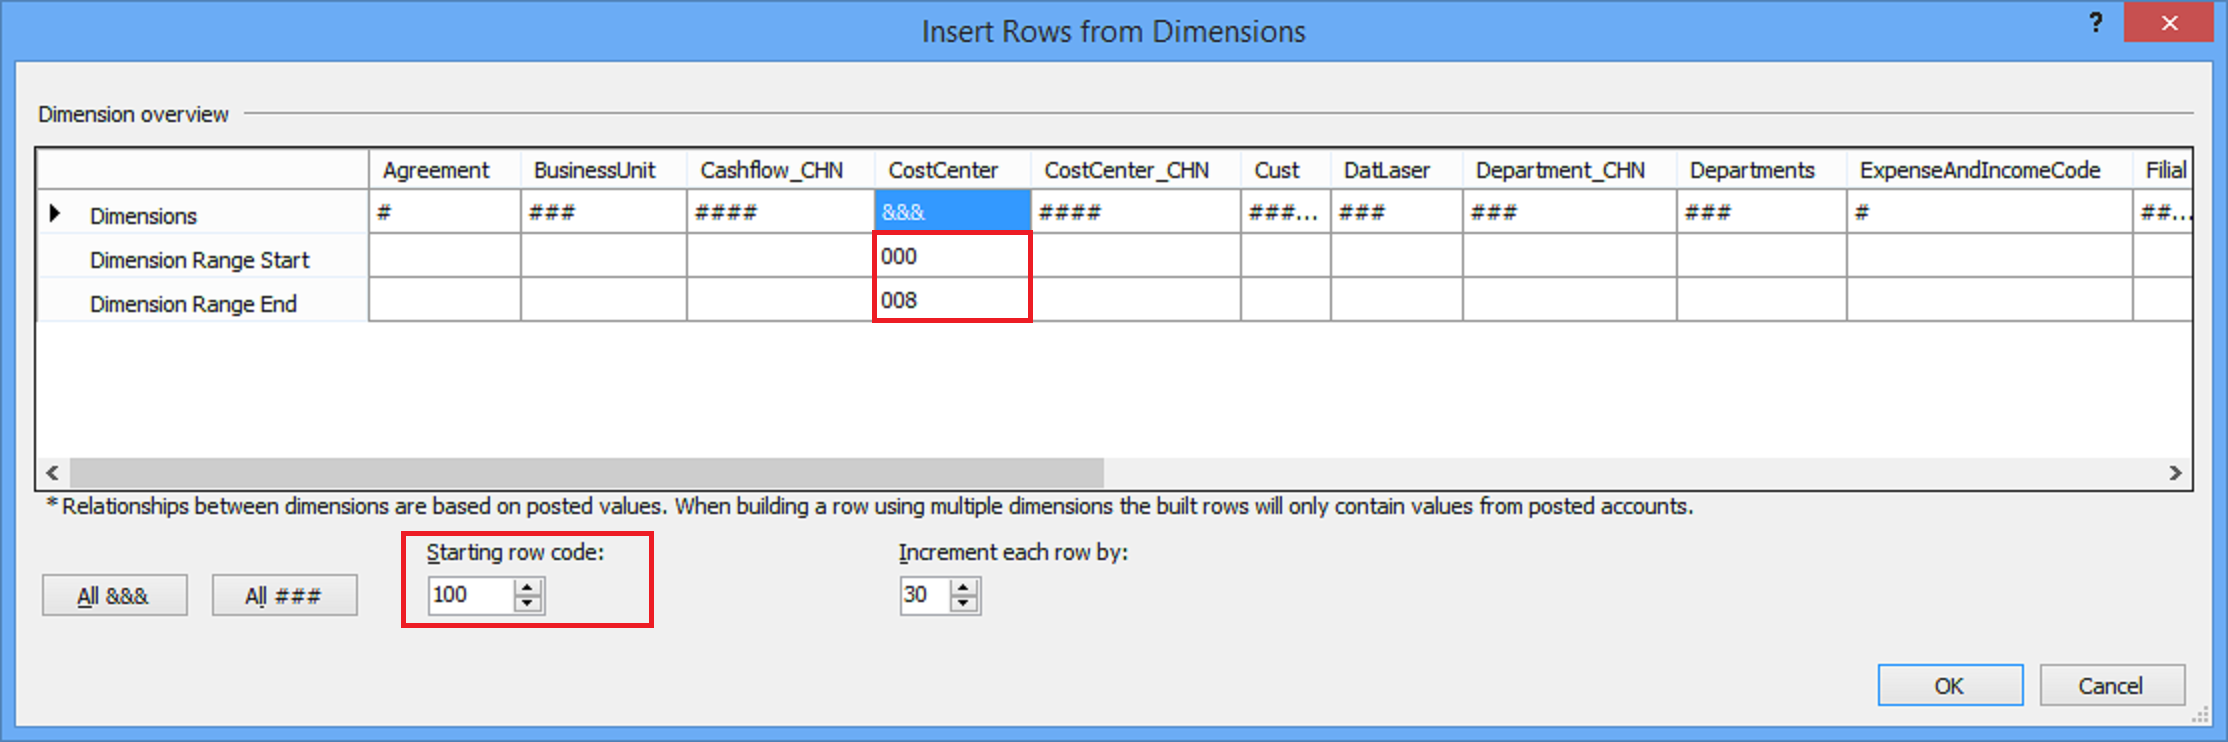
The first area to pay attention to is the ability to set the Dimension Range Start and Dimension Range End values. The dimension identified with the ampersands will be the dimension that is inserted into your report. The default will always be MainAccount, but for this example, Cost Center will be used.
Enter a Dimension Range Start under Cost Center of 000 and a Dimension Range End of 008.
Click OK and this will result in the following Row Definition.
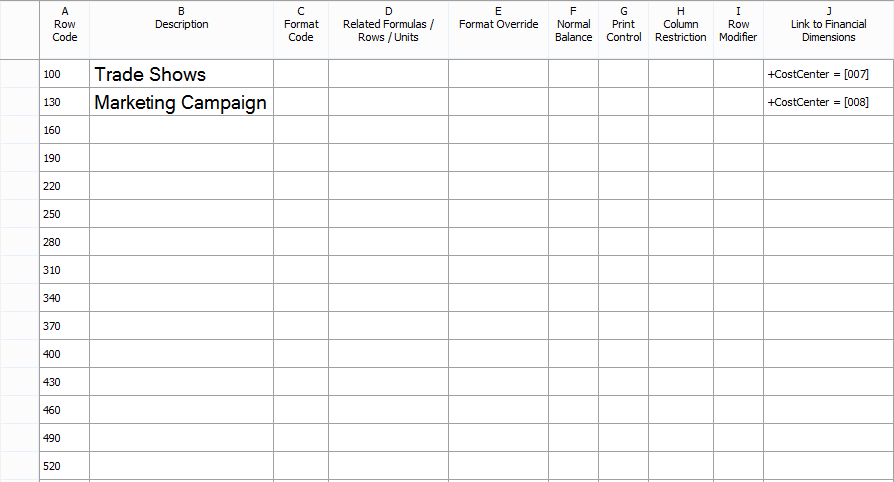
Next, return to Edit | Insert Rows from Dimensions and enter a Dimension Range Start under Cost Center of 009 and a Dimension Range End of 014. Before clicking OK set the Starting row code at the bottom portion of this window to 220. This will skip two lines before starting this new range.
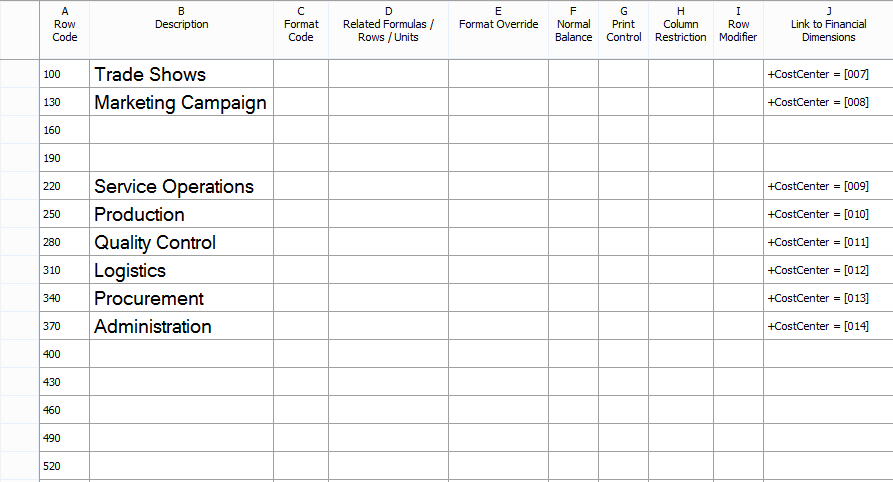
Continue adding ranges to the report. In this example there are only a few values, but these steps are the same if you have hundreds of dimension values.
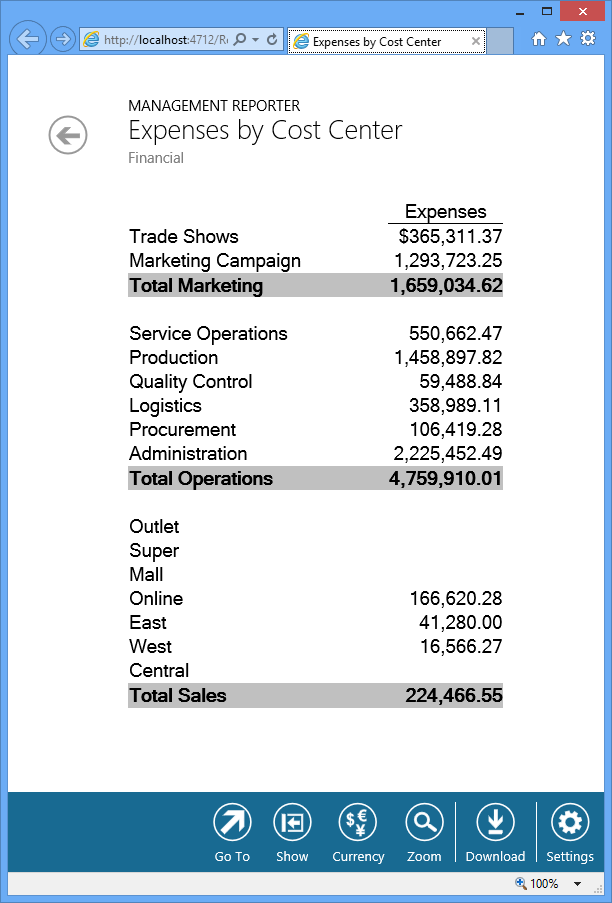
The final step is to add subtotals to the groups. This report was created using a Column Definition that restricts to just the expense accounts, but could be used in many other ways as well. An example final report will look something like this:
When building reports in detail don't forget that you can collapse the detail and show summary lines only as described here.