How to create a rolling 12 month report
Earlier this year at Convergence, we had the opportunity to showcase some of our customer’s reports. During one of the consolidation reports, when we showed the column definition, we had customer’s frantically scribbling down the syntax in the column definition for a rolling 12 months in one column. So I thought I would take the opportunity to show you two ways to do a rolling 12 months column definition.
There are two ways customers like to use a rolling 12 months report:
- Each column represents a month and the report dynamically always shows the last 12 months.
- One columns contains the total of the last 12 months, and each month dynamically updates with the correct data.
Both methods take advantage of using Base in the Period field in the column definition. The first method is having each column represent a month for the last 12 months. In this example you add a column with the Period syntax of Base -11, a second column with Base-10, a third column with Base-9 and continue this until you have a column of Base. Then add a calculated column with the range of columns you want to add together.
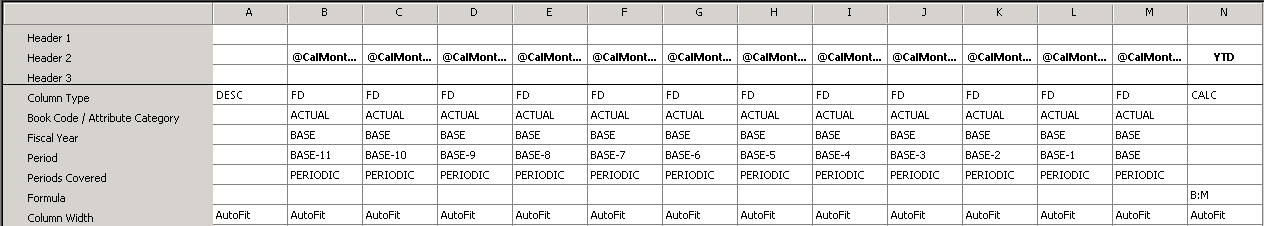
Figure 1: Column definition for month by month
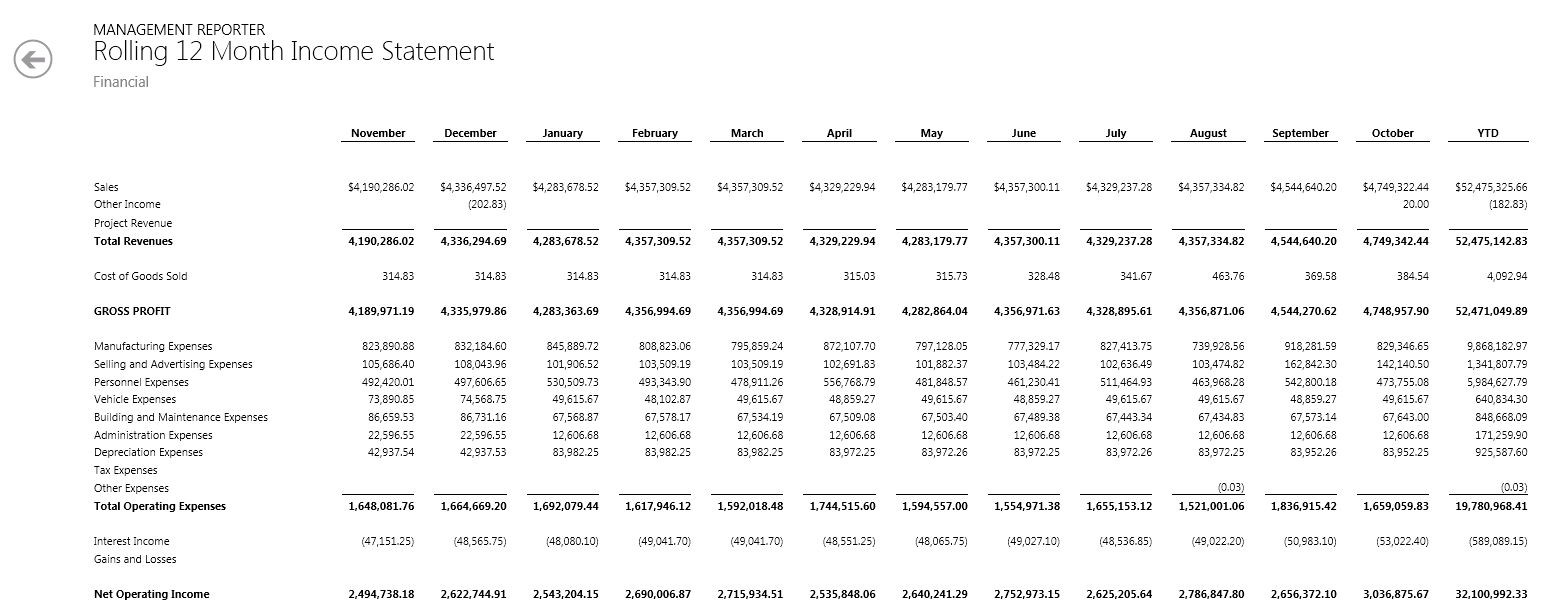
Figure 2: Rolling 12 month report, month by month
The second method allows the user to see the last 12 months in one column. Customers really enjoy doing this especially for side by side reports with divisions, departments or companies. In this example, you add a column with the Period syntax of Base-11:Base. If you want to continue by showing a specific dimension value or company you can add that using the dimension filter or reporting unit restriction column.
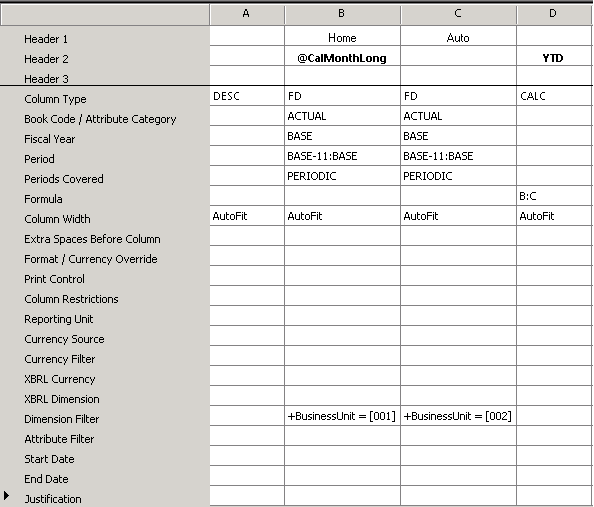
Figure 3: Single column definition for rolling 12 months
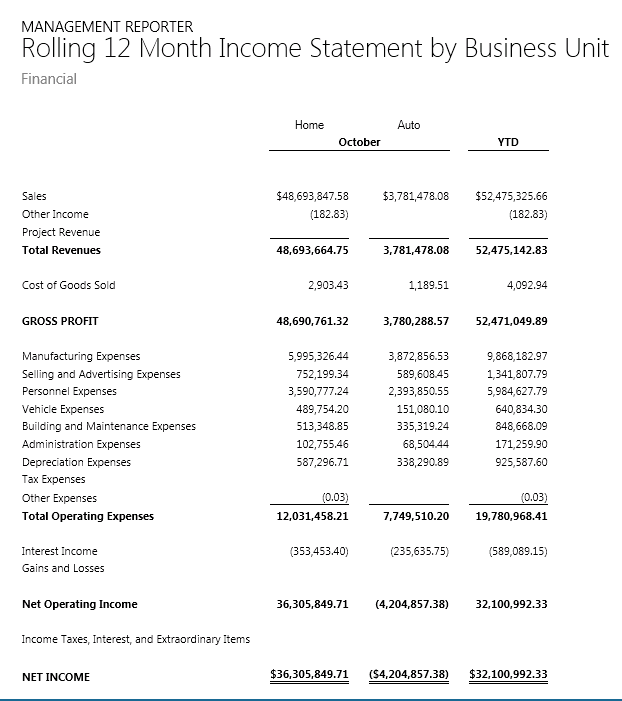
Figure 4: Rolling 12 month report, single column