Taking Your Financial Reports to the Next Level with Management Reporter – Weekly Campaign Revenue (2 of 8)
The second report in the “Taking your Financial Reports to the Next Level with Management Reporter” series is called “Weekly Campaign Revenue.” Managing the revenue associated with various marketing campaigns can be challenging. But, if you’re using dimensions in your Microsoft Dynamics General Ledger account structure, you can easily create a report in Management Reporter to help you track weekly revenue for the various marketing tactics you’ve put to use in your business.
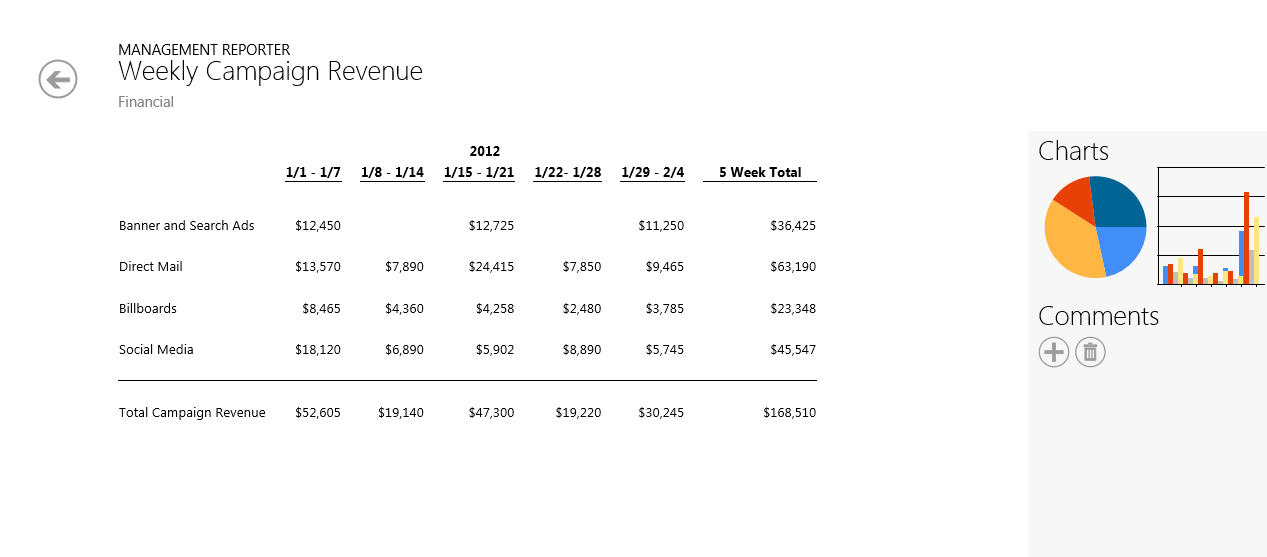
The rows of the report display the four key marketing campaign tactics being used, as well as the total. The columns are structured to display each week in a five-week period that the marketing campaigns are being tracked, along with the total. Two charts also have been created for this report. One shows a pie chart breaking down the revenue by total marketing campaign, making it easy to see that billboards are driving the least amount of revenue. The second chart shows week-by-week revenue by campaign, allowing someone to easily pinpoint that no revenue was received by banner and search ads over a 2-week period.
This video includes information on how to create a similar “Weekly Campaign Revenue” report for your company.
[embed]https://www.youtube.com/watch?v=ZY3-nEYFPhQ&feature=youtu.be[/embed]
In summary, the key features included in the “Weekly Campaign Revenue” were:
- Start and end dates were defined to create each weekly column
- Charts for total revenue and weekly revenue by campaign were created in the Management Reporter web viewer
Links to other posts in this series:
- Quarterly Revenue by Business Unit - Are we making a profit?
- Weekly Material Usage - Are we being efficient?
- Budget to Target - Are we hitting targets?
- Postings Audit - Are we entering transaction accurately?
- Statement of Cash Flow - Are we making the right investments?
- Quarterly Tax Form - Are we getting the data needed for taxes?
- Financial Matrix - How are we performing?