Taking Your Financial Reports to the Next Level with Management Reporter - Quarterly Revenue by Business Unit (1 of 8)
The first report in the “Taking your Financial Reports to the Next Level with Management Reporter” series is called “Quarterly Revenue by Business Unit.” This report is designed to help someone like the sales manager zero in on the most critical revenue information.
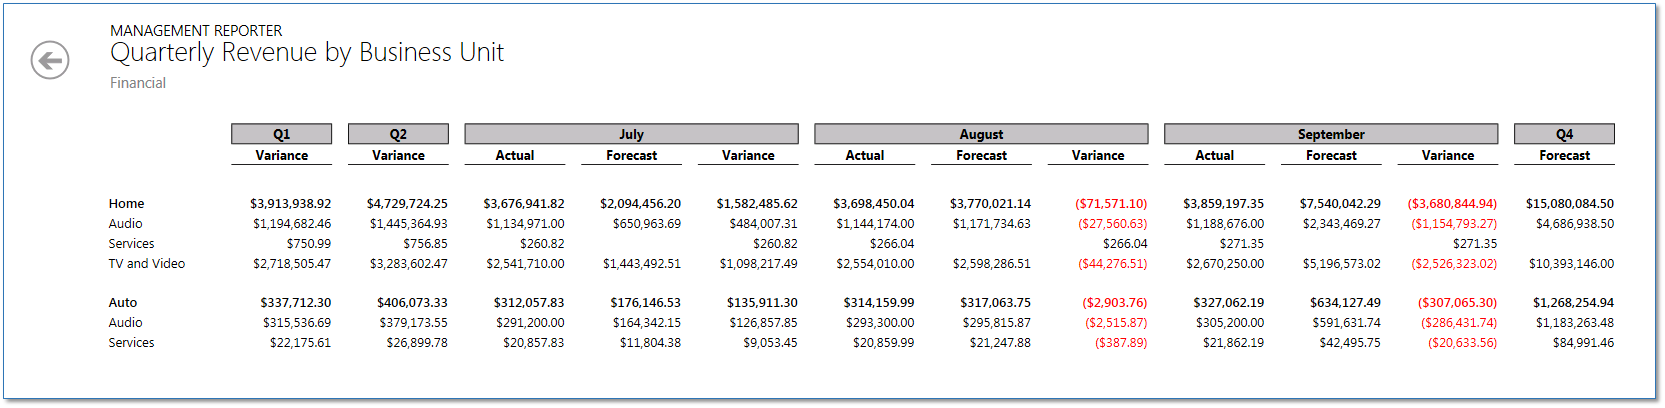
Assume the company is in Quarter 3 (Q3) of their fiscal year. Because Q1 and Q2 are past, only the variance amounts (difference between actual and forecast) are shown for these quarters. For Q3, the current quarter, the report shows a lot more detail. The quarter is broken down by month, plus actual, forecast and variance amounts are displayed. Finally, for Q4, only the forecast is displayed. For the entire report, negative amounts are displayed in red to help the sales manager quickly identify the key areas for further analysis.
This video includes information on how to create a similar “Quarterly Revenue by Business Unit” report for your company.
[embed]https://www.youtube.com/watch?v=z7EllJ8sZjw&feature=youtu.be[/embed]
In summary, the key features included in the “Quarterly Revenue by Business Unit” were:
- Rows were restricted by dimension (in this case, business unit)
- Period ranges were entered in the column definition to designate the quarterly columns
- Non-printing quarterly columns were defined to be used in calculations, but not displayed in the report
- XCR was designated in the Print Control for variance columns to ensure favorable and unfavorable variances were displayed correctly
Other posts in this series:
- Quarterly Revenue by Business Unit - Are we making a profit?
- Weekly Material Usage - Are we being efficient?
- Budget to Target - Are we hitting targets?
- Postings Audit - Are we entering transaction accurately?
- Statement of Cash Flow - Are we making the right investments?
- Quarterly Tax Form - Are we getting the data needed for taxes?
- Financial Matrix - How are we performing?