Alternative Income Statement format -- how did you do that?
The variety of financial reports that you can create with Management Reporter is unlimited. We show examples in our demos of many different kinds of reports, taking advantage of the dimension filtering capabilities within Management Reporter. Generally in report design you are defining the natural accounts in the Row Definition, while the Column Definition defines the periods covered and the book codes. Within Management Reporter, you have the added flexibility to design a Row Definition on any segment or combination of segments from your account structure.
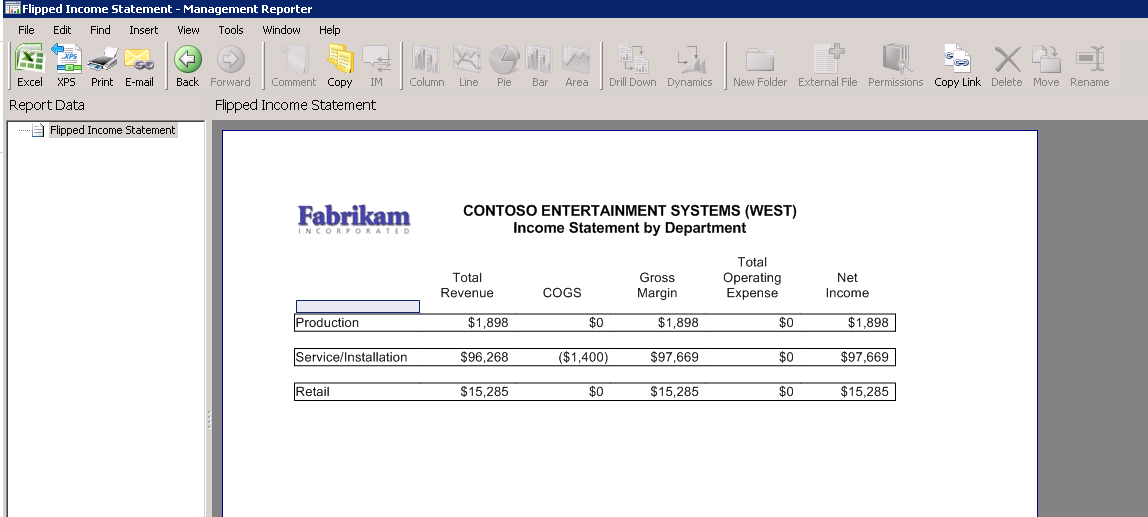
Using this alternative design, one example of the report you can create is what we informally call a “flipped income statement.” It shows each of your company’s departments in the rows, then the summary sections of an income statement in the columns (i.e. revenue, margin, expenses, etc.). This report can help you easily compare revenue and expenses by department. Or, you can set it up using another dimension in the rows, if you want to compare against location, geography, division or any other dimension that you’re tracking.
Here’s what a “flipped income statement” looks like:
It’s actually pretty easy to create this report.
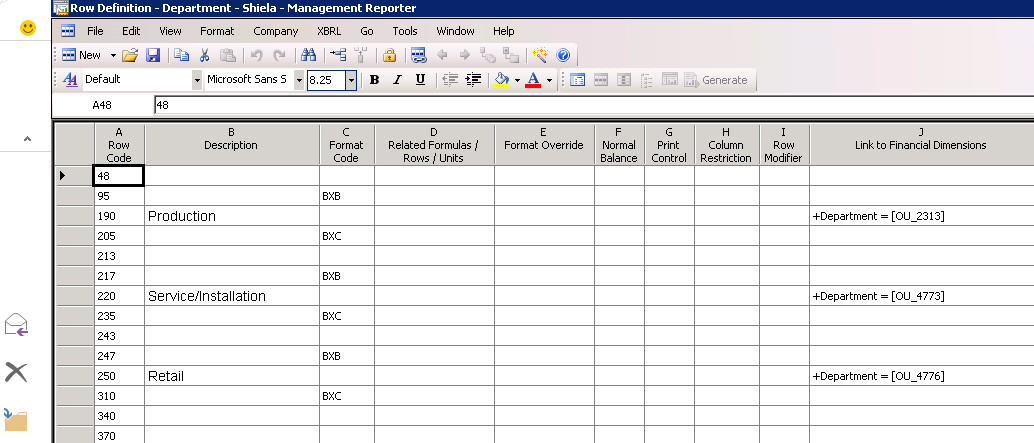
In the Row Definition, just define a row for each department that you want displayed on the report. You can select “Insert Rows from Dimensions” feature from the Edit menu to create these rows very quickly. Here’s a screenshot where rows are set up for each dimension. The other rows shown are used to but the box around each row, as shown in the report example above.
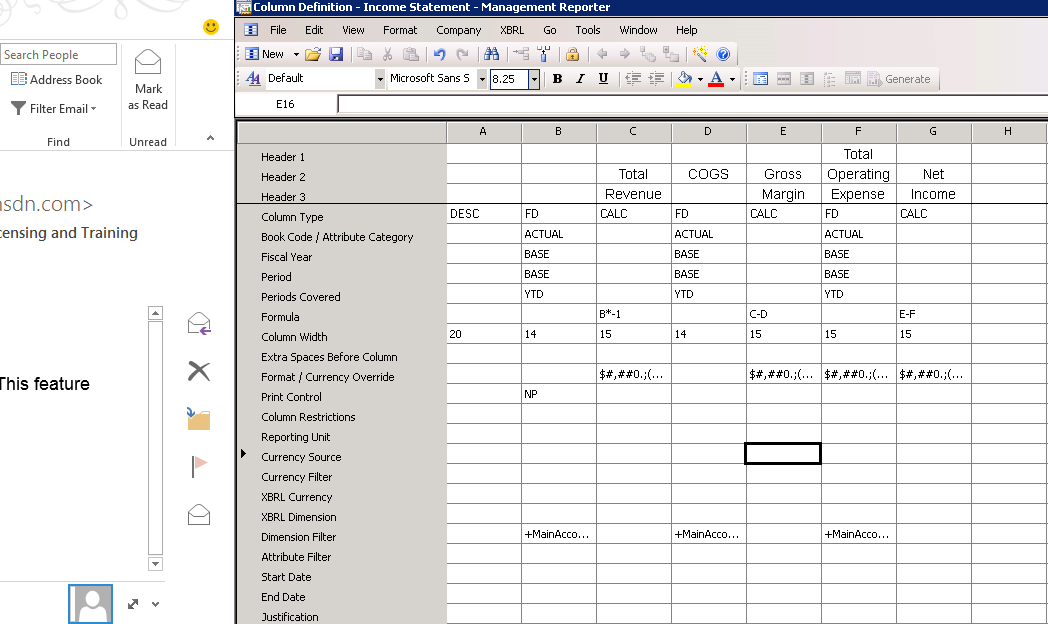
Then, for the Column Definition, create columns for each of the income statement summary sections that you want to display on the report. In this example, here’s what is defined in each column:
Column |
Notes |
A |
Description column which will display the name of each Department defined in the related Row Definition |
B |
Column used to bring in summary total for all revenue accounts; this is a hidden column |
C |
Calculated column used to reverse the sign on the Revenue account balance in order to make these credit amounts appear positive on the report |
D |
Column used to bring in summary total for all COGS (Cost of Goods Sold accounts) |
E |
Calculated column for Gross Margin: Total Revenue (column C) minus COGS (column D) |
F |
Column used to bring in summary total for all expense accounts |
G |
Calculated column for Net Income: Gross Margin (column F) minus Total Operating Expense (column G) |
Put it all together in a Report Definition and you have this report that will help you better compare the various departments in your business.