Microsoft Forecaster: Using menus to drill down on reports
With budgeting season fast approaching, it’s time to start looking at how you can take advantage of features in Microsoft Forecaster that you may not be using or you are underutilizing. Menus are one of these features. Microsoft Forecaster contains different types of menus for different reasons:
- Input Menus – control the input sets users have access to
- Selection Menus – provides customization capabilities for users such as the ability to launch reports, run external commands, execute tasks, and list tables for drill down on reports.
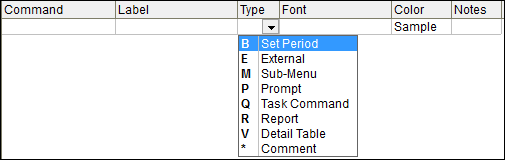
Figure 1: Menu Types
In this blog, we are going to focus on the Selection Menu type V , Detail Table, as this is probably one of the most common types of menus that can quickly add value to your organization.
Microsoft Forecaster contains four detailed tables that contain important budget data that reports can drill down to. The following list contains the four types of data and their table names:
- Human Resources, D_HR
- Line Items, D_ITM
- Capital, D_CAP
- Custom Planning, often used for Revenue, D_REV
NOTE : You can create custom detail tables also. Refer to the Microsoft Forecaster help topic Custom Detail Tables for more information.
The table names are what are used in the menu, so let’s see how to create one. Most often, the user that drills down is a Budget Administrator, Controller, Department Manager or CFO who wants to see the entire budget for the entire organization or department and drill down to details. Because they are often looking at a profit and loss report, we will create a detail menu with all four tables included.
The first step is to add a new menu by clicking Build > Menus, clicking Insert and typing a name.
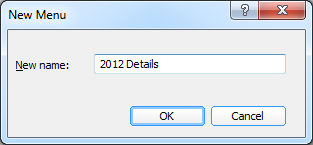
Figure 2: New Menu
The second step is to add the Commands, Labels and Types. The following is a list of tips for creating the commands, labels, and selecting the Type.
- The syntax for the Command is the table name, minus the D_, and then the name of the Input Set.
- You can have blank command lines and use the Type of * (Comment) to add spacing in your menu table.
- Blank command lines with a label defined and Type of * can help provide headings or directions to the user.
In this example, I created a heading with some directions, and then listed the four tables with the Input Set name 2012 Budget. You can optionally change the color and font.
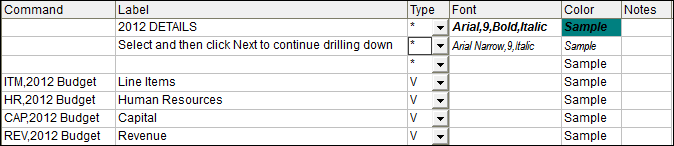
Figure 3: Detail Table Menu
The last step is to add the menu to the report you want to drill down on. If you already have the report created, open the Reports Worksheet (Build > Reports Worksheet) and add it to the Detail Menu field, or step through the Report Wizard and add it during the Detail Menu prompt.

Figure 4: Report with Detail Menu
When everything is set up and you drill down on the reports you will be prompted when you get to the level of the report that contains the account and segment. When you then select Revenue it shows you that for Sales -Televisions , the full amount is coming from the Midwest region in the Kansas City store.
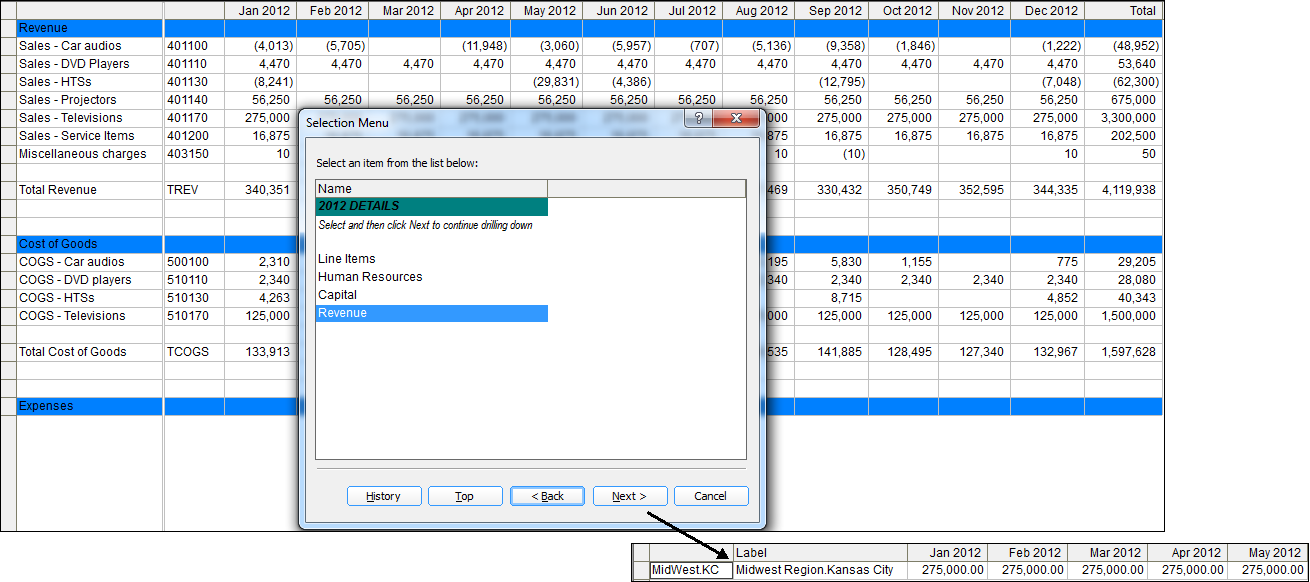
Figure 5: Drill down to Revenue
Using a detail menu provides the extra insight to the report consumers so that they can get to the lowest level of detail in a budget number. By creating a detail menu containing all the detail tables, you can minimize the number of reports a user looks at provide them all the data they need in one location.