Creating a Management Reporter report to import data into Microsoft Forecaster
As we move into budgeting season for many customers, it’s a good idea to use Management Reporter to create an actual data import file for into Microsoft Forecaster. This actual data can be great for creating forecasts and baselines in Microsoft Forecaster. For reporting on Microsoft Forecaster data in Management Reporter refer to this previously posted blog.
First, let’s review the file format required for importing data into Microsoft Forecaster.
- A text file that is fixed width or delimited.
- The file must contain the IDs of each segment/dimension in Forecaster and the periods of data.
- No dollar amounts or commas on the amounts.
- For revenue, income, liability and equity amounts that are positive, the import file should show these amounts as negatives.
Our first step in the process is to create the report in Management Reporter. Second, we will generate it to Excel and then import the data into Microsoft Forecaster. In the following examples, there are two segments/dimensions for budgeting: department and main account. The key to creating the report in Management Reporter is to remove the rich formatting options selected by default, and by using the @UNITNAME feature in the row definition. Let’ review each building block.
Row Definition
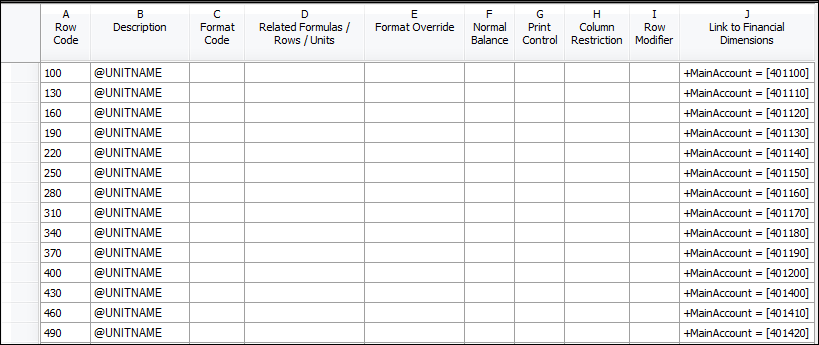
Figure 1: Row Definition
- Create the row definition based on the accounts you want to import. Most often this is profit and loss accounts. Be sure to remove the Normal Balance of C for any of the account types mentioned above that have typical credit balances.
- Populate the Description column with @UNITNAME. This will bring in the name from the Reporting Tree, which should be the segment name in Microsoft Forecaster.
Column Definition
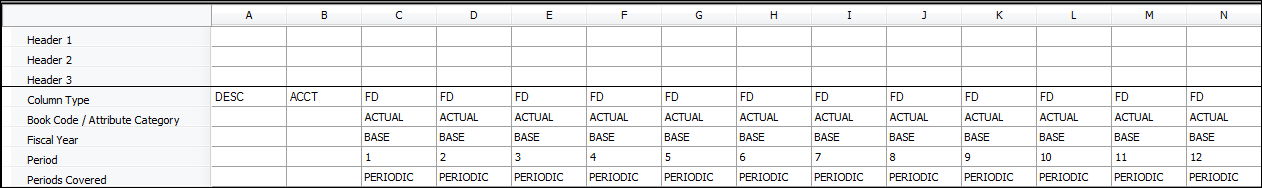
Figure 2: Column Definition
- Create a Description and Acct column, followed by 12 periodic columns.
- Type the period number for each column.
Reporting Tree Definition
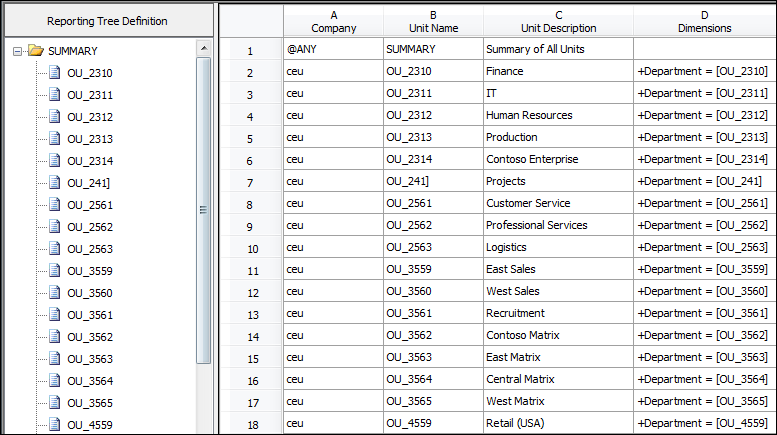
Figure 3: Reporting Tree Definition
- Build a reporting tree definition with the segments that are in Microsoft Forecaster. In this example, I am using department.
- Change the Unit Name column to be the dimension/segment value.
Tip: I bring the data to Excel and use a MID function, which returns the characters from the middle of a text string, to trim the dimension description.
Report Definition
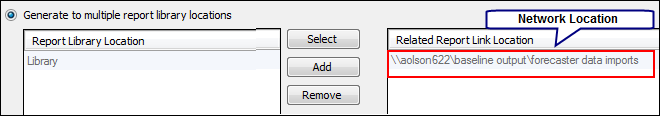
Figure 4: Output and Distribution
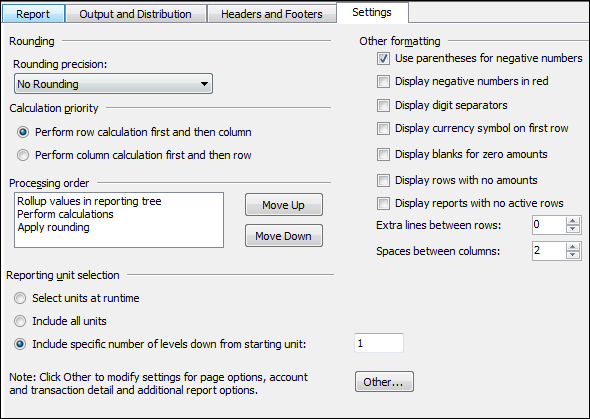
Figure 5: Settings
- On the Report tab, verify the Detail level is Financial.
- Select the Row, Column and Reporting Tree definitions that you just created as building blocks.
- On the Output and Distribution tab (Figure 4), put a network location in the Related Report Link Location field.
- On the Output and Distribution tab make the following changes in the Microsoft Excel options at the bottom:
- Clear Include fonts and shading
- Select Generate to single worksheet
- Clear Include comments.
- On the Headers and Footers tab, delete all headers.
- On the Settings tab, in the Other formatting section (Figure 5), clear all check boxes except for Use parentheses for negative numbers.
You are now ready to generate the report and open it in Excel from your network location.
Tip: select the checkbox Don’t show these options again. Your selection will be used by default in the future. This will open the report in Excel with one-click each time.
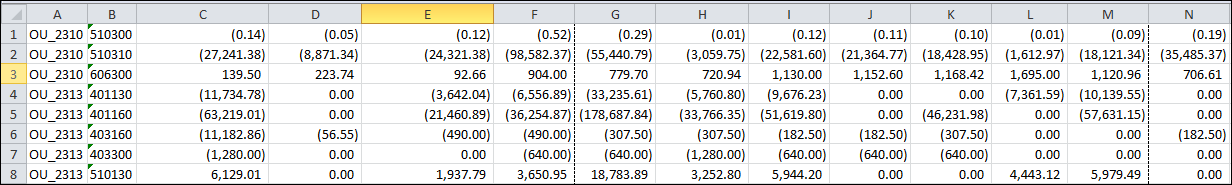
Figure 6: Output in Excel
Once the report is opened, remove any lines that have Summary level data and click File > Save As and save it as a delimited text file.
It’s now ready to be imported into Microsoft Forecaster. In Microsoft Forecaster, click Tools > Import > Data and step through the import data wizard by typing a name and browsing to the file.
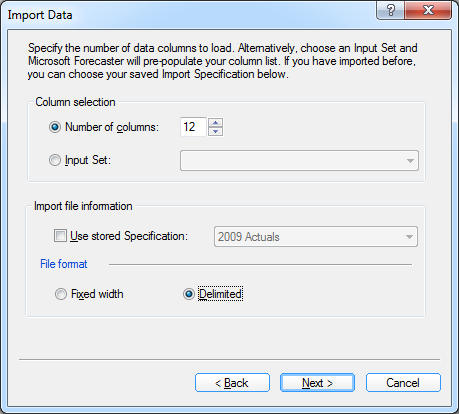
Figure 7: Import Data
Type the number of data columns you are importing, in this example 12, and choose Delimited as the file format.

Figure 8: Delimiter and Position Mapping
Select the periods you want to import the data to and then type the position of the Department and Account from the file.
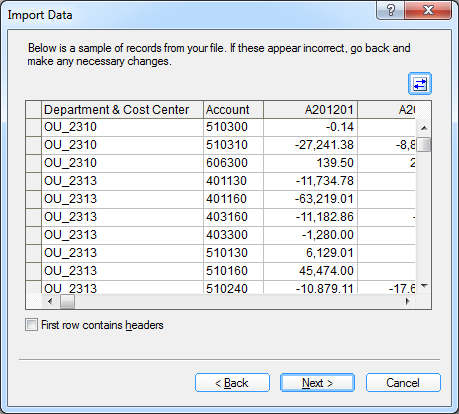
Figure 9: Preview
Preview the data and verify it aligns correctly with the Department, Account and Periods, and then finish stepping through the wizard.
Creating this type of report in Management Reporter makes it easy to get a format necessary to import data into Microsoft Forecaster, so that you can create your forecasts and baselines for budgeting.