Management Reporter Features of the Week: Viewing Reports and Using Dimensions
Now that Convergence 2010 is over, time to get back to feature of the week! I hope those of you that had the opportunity to attend Convergence this year had a great time and learned a bunch! I know that I did!
In this post, I’d like to focus a bit on viewing reports in the Report Viewer, as well as, talk about the great flexibility Management Reporter offers using dimensions.
Viewing reports
In my last post, I focused on the Report Library piece of the Report Viewer. This time, I’d like to focus on the Report Data (viewing reports) piece of the Report Viewer.
The Report Data tab in the Report Viewer is where generated reports are viewed.
The report below was generated with a reporting tree. Notice that the tree is displayed in the left pane of the report. You can click through each of the units using reporting tree, or double click on rows of data to drill down to each reporting unit.
You can also zoom out to see the entire report or zoom in using the slider in the lower right hand corner.
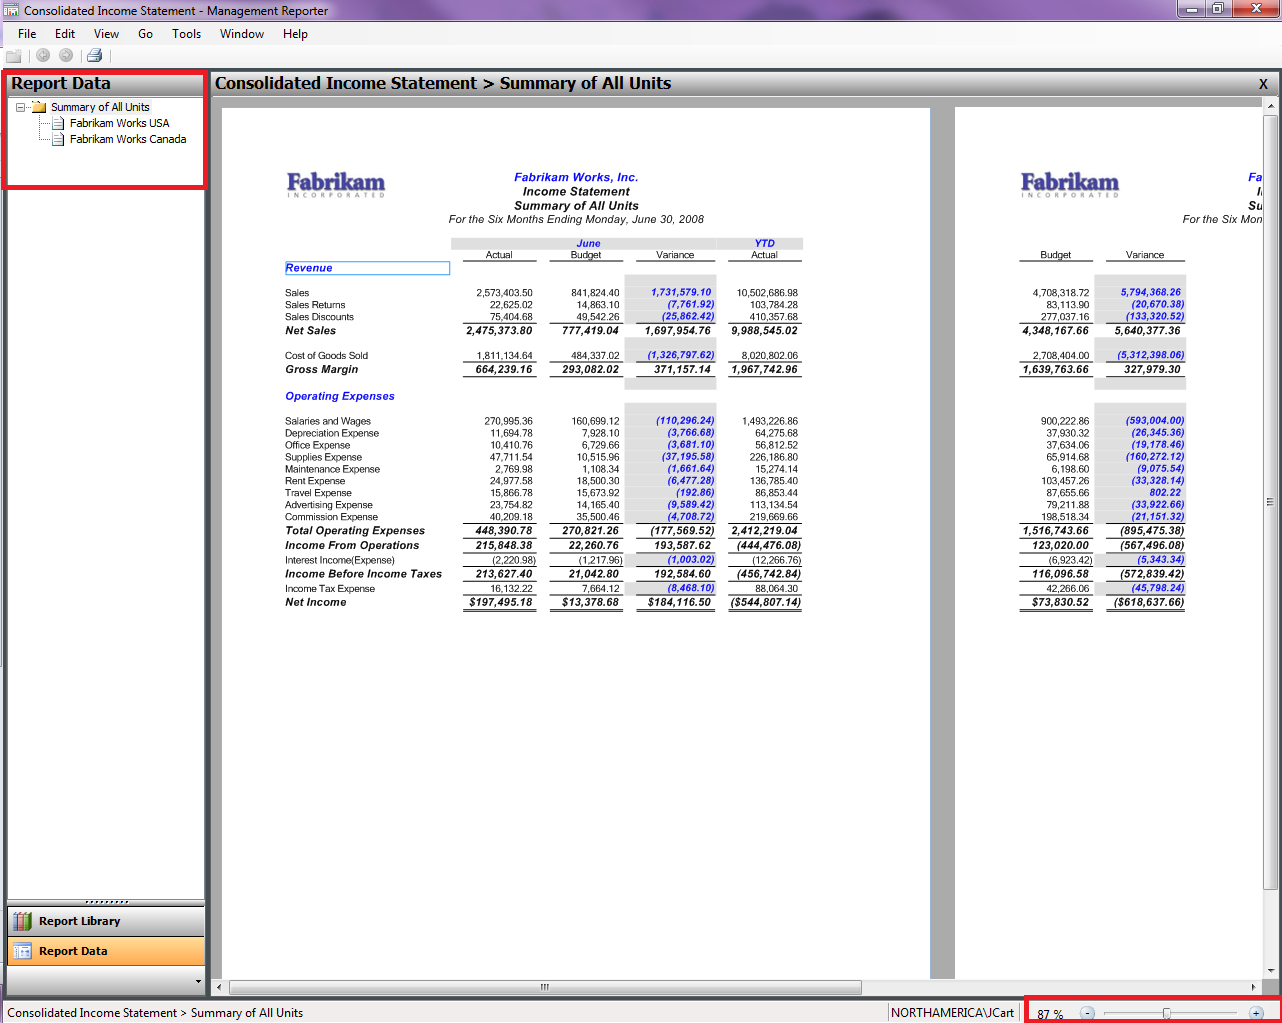
Using the View menu, you can hide the navigation pane to get more real estate on your screen and see the entire report. You can also use the back and forward buttons in the toolbar to navigate once you’ve drill down on a row.
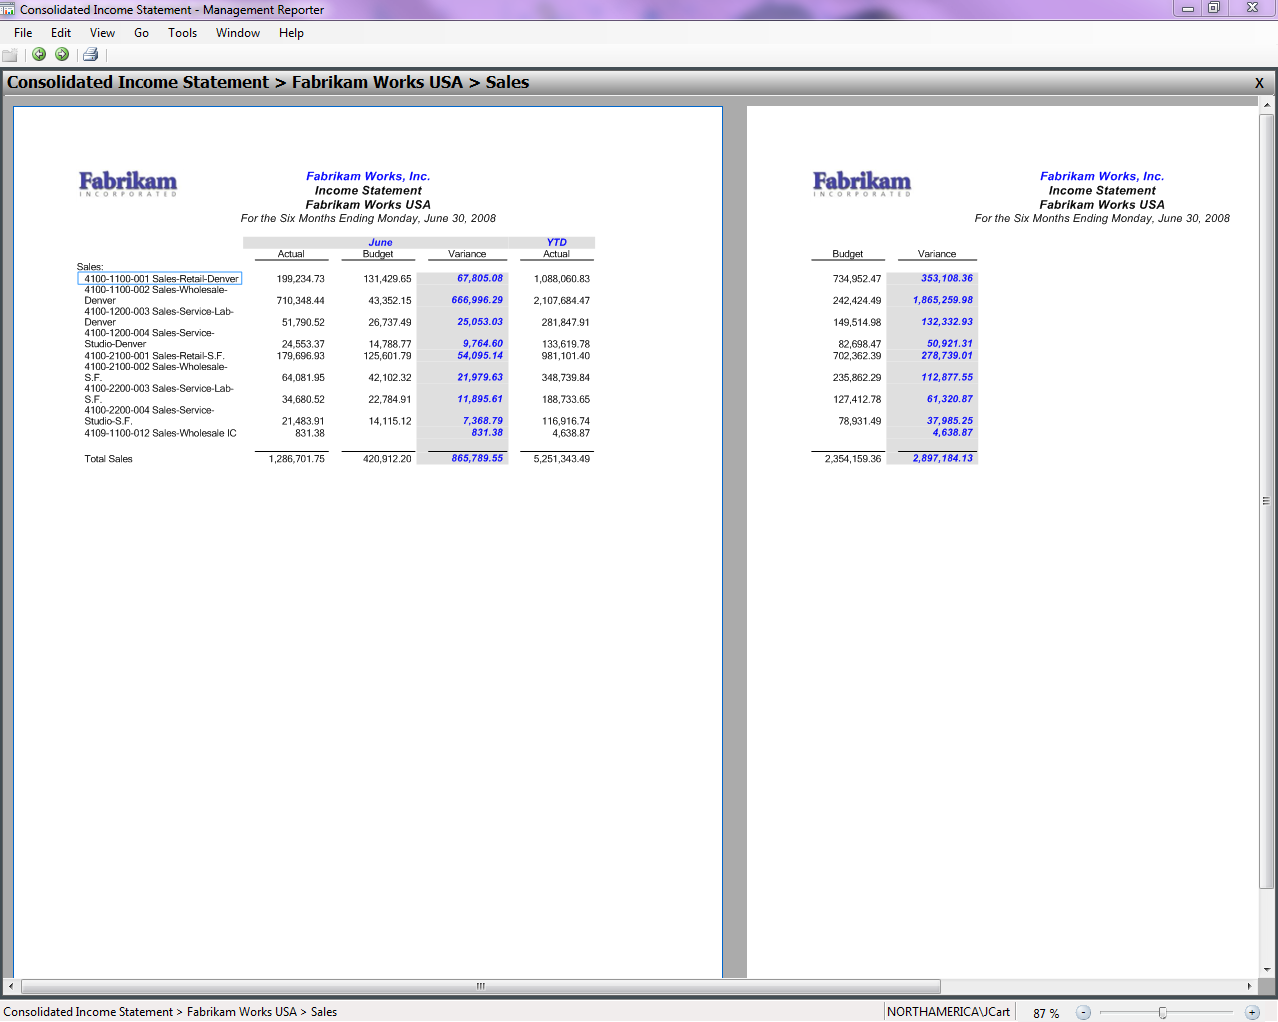
This is a big improvement from FRx where the reporting tree was a separate page and each time you drilled into a row, it opened a new page. Now, everything can be viewed in one window!
Using Dimensions
Management Reporter uses dimensions for specifying the data you want to see in your financial report. This data could be from your main account, departments, locations, etc. Using dimensions, instead of a segment account mask that FRx uses, allows you to create different types of reports and get the data you want and need on those reports. So, throw out that FRx rule book! A whole new world of report design awaits you!
The dialog below can be used in rows, columns and trees. You can use any combination of dimensions in any of your building blocks.
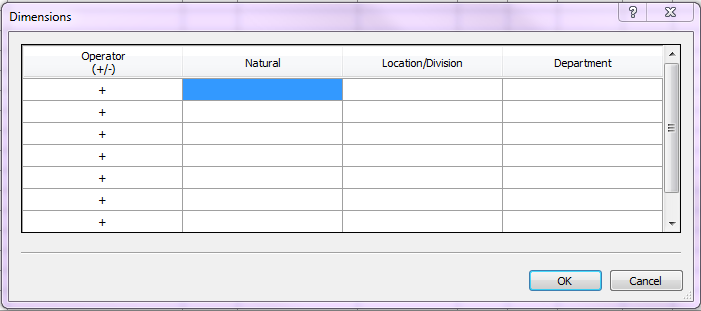
You can use ranges of dimensions or create dimension sets on any of your dimensions! These sets can be used not only in the row definition, but in the column and tree definition as well.
Let’s take a closer look at each of the building blocks to see what this means.
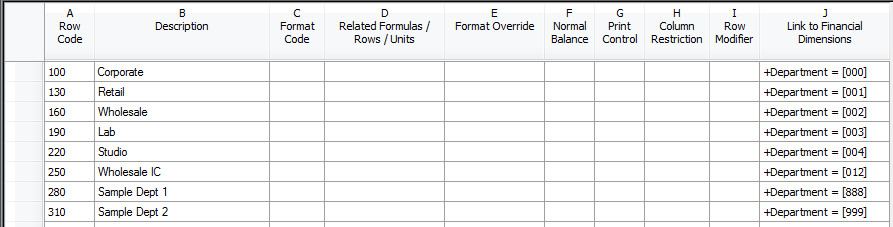
The row below was created with only the Department dimension defined. This row and a column create a valid report. No reporting tree is needed.
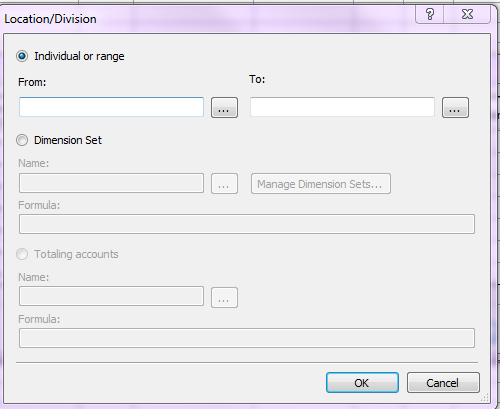
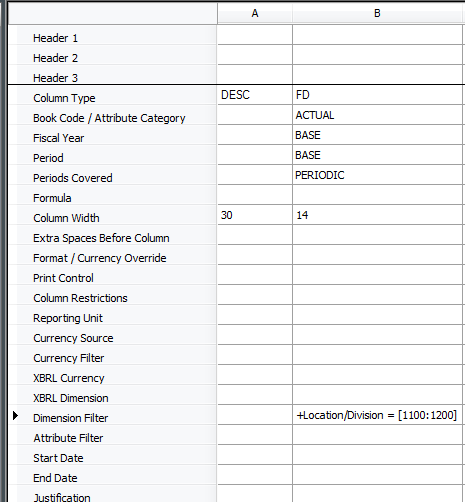
This column contains a range of Location/Division. The fully qualified account mask isn’t required when filtering in columns.
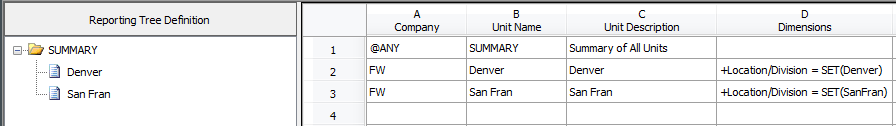
But, I think the biggest bang for the buck can be found in the reporting tree. You don’t need to create multiple levels in the tree to get what you want. In the reporting tree below, I created two dimension sets for Location/Division, one for Denver and one for San Francisco.
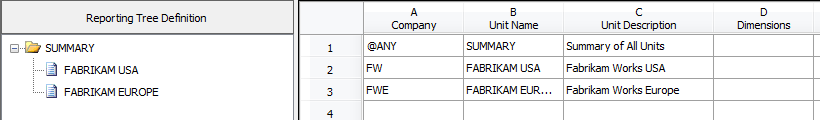
One other cool thing about trees that I want to show you, the tree below is a just a roll up of two companies and super easy to create. (It doesn’t look like it would be valid, but it is!)
Whew! That was a lot of great information in one post! I hope you learned a cool new trick about Management Reporter.
Be sure to check back next week, I’ll be showing you how Management Reporter supports XBRL (eXtensible Business Reporting Language).