IntelliTrace
1. Introduction
2. How it works :
a. Events and Call Information
b. Recordings - iTrace file
d. Specify modules
e. Intellitrace Window
f. Navigation Bar
g. Running the trace file
3. Tips
4. Summary
1. Introduction
Most developers are familiar withVisual Studio debugger. Up to Visual Studio 2008, you have an option to have a snapshot of the process. Those versions didn't give you the ability to go back and check other events and methods which might be responsible for the current state of the application. If you miss a single step, you need to restart debugging. Breakpoints/traces monitor the state of application but at times, it becomes very difficult to capture all information within the debugger.
The problem becomes more serious and time-consuming if you need to share your findings with others. What happens if the problem can't be reproduced on your colleague's machine?
In Visual Studio 2010 Ultimate Edition, there is a new feature called Intellitrace (also known as Historical Debugging).
Historical Debugging or Intellitrace
With Intellitrace, you can record the debug session and also save the application state for future reference. It enhances your live debugging experience. You can go back while debugging to check the events/local variables & call-stack.
2. How it works
a. Events and Call Information
Here is the options window:
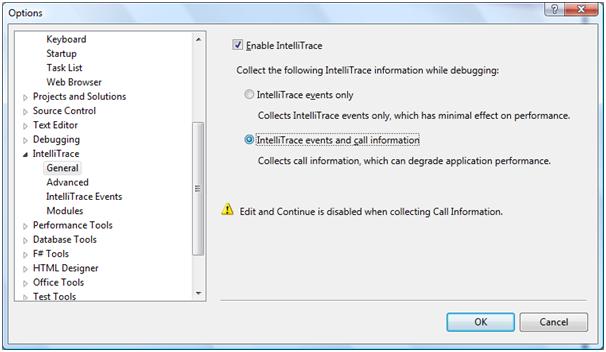
You can get this Window by selecting Tools>Options. By default, Intellitrace is enabled.
If enabled, you can either set it to the default "Events only" level or set it to "Events and call information".
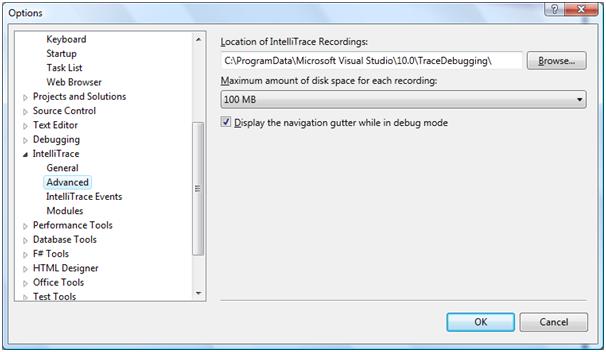
b. Recordings - iTrace file
Visual Studio saves a file called tracelog (.iTrace) for each debugging session. The name of the log file is unique and contains the date-timestamp for future reference. You can specify the location of the tracelog file and also control the maximum size of the file.
The iTrace filenames are self explanatory. For example the following file is saved on my machine:
Typical file format is:
<application_name> _<YYMMDD_HHMMSS>.iTrace
[As you can see the application name is followed by the vshost here. You may need to disable vshost to get the iTrace for the application not running under vshost. Visual Studio hosting process can be disabled by unchecking Project>Project_name Properties>Debug>Enable Debuggers>Enable Visual Studio Hosting Process.]
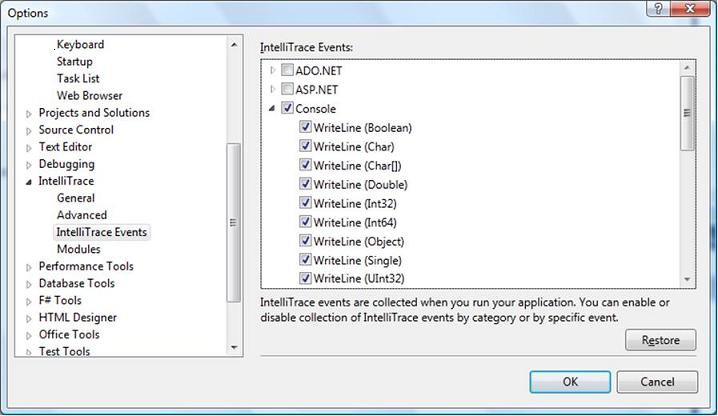
c. Capturing Events
You can capture following categories of events:
i. ADO.Net
ii. ASP.Net
iii. Console
iv. Data Binding
v. Environment Variable
vi. File
vii. Gesture
viii. Lazy Initialization
ix. Registry
x. Service Model
xi. Threading
xii. Tracing
xiii. User Prompt
xiv. WorkFlow
xv. XML
You can select them by menu Tools>Options>Intellitrace>Intellitrace Events. Under each category, there is a list of events that can be opted individually.
d. Specify Modules
You can also specify the modules for which you need to record events, methods & parameters.
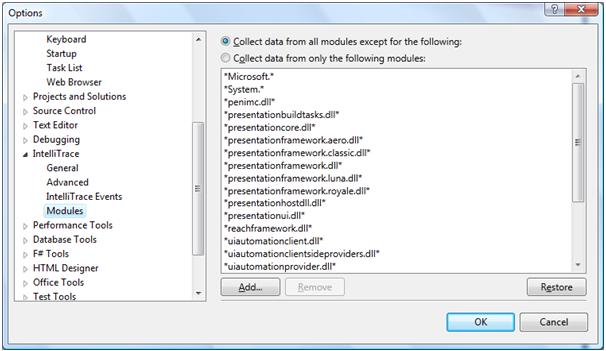
Either you can make an exclusion list or, an inclusion list whichever is smaller. This gives a lot of flexibility in instrumentation. For example, if you don't want to capture details about the module presentationcore.dll, you can include in the exclusion list so that its methods and their parameter details are not captured. This helps in reducing the size of the tracelog file and also filters useful information needed for debugging.
e. Intellitrace Window
For this example, IntelliTrace is enabled. Create a simple Winforms application and start debugging. You will find that a new window appears called "Intellitrace". [If not visible, you may need to click the Intellitrace TAB in the pane.]
Familiarity with the Intellitrace Window: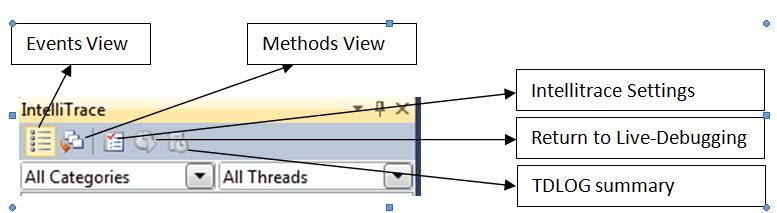
There are two Views:
I. Events View - In this view, captured events are shown. You can filter the categories of events from the drop down combo-box on the left side displayed in the figure as "All Categories". Similarly, you can concentrate on some specific threads as well (selected by the next combo-box shown as "All Threads".
II. Methods View - displays only when method logging is enabled(i.e. when "Events and call information" is selected.
This Intellitrace window shows us the default events that are captured. For example, two events are shown below:
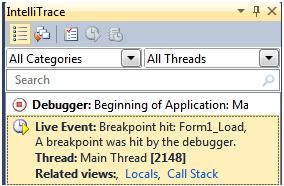
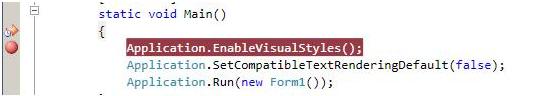
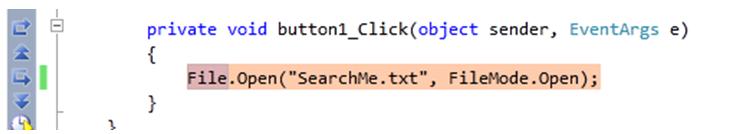
I am currently at a breakpoint which is showing as the yellow arrow button. If the first button is clicked, the debugger reaches the main function and the side bar (navigation bar) shows an arrow sign with a clock:
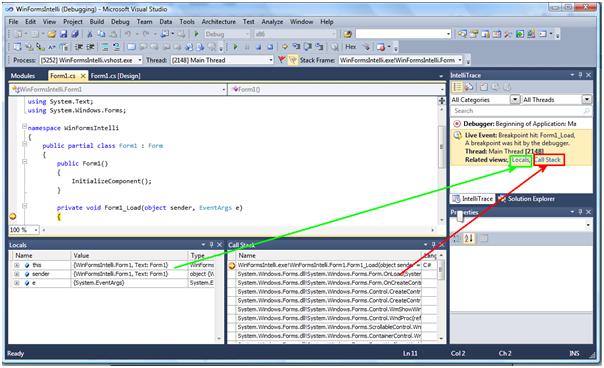
You can see the Call Stack, locals and exceptions by clicking the options available with each captured event in Intellitrace window.
f. Navigation Bar
When the exception is selected in the Intellitrace view, Navigation Bar becomes visible.
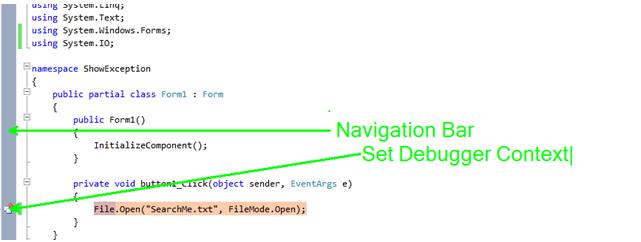
If you click Set Debugger Context button, the debugger will set the context to the current event.
As you can see, there are step out, go to previous call, step in, go to next call, and go to live mode buttons available.
g. Running the trace file
Now suppose you are given a project with the trace log to reproduce a bug. How do you run the file and reproduce the issue?
i. Open the tracelog file in Visual Studio. [Use the menu option File>Open and select the iTrace file.]
ii. In Visual Studio , You will see Intellitrace summary page like this :
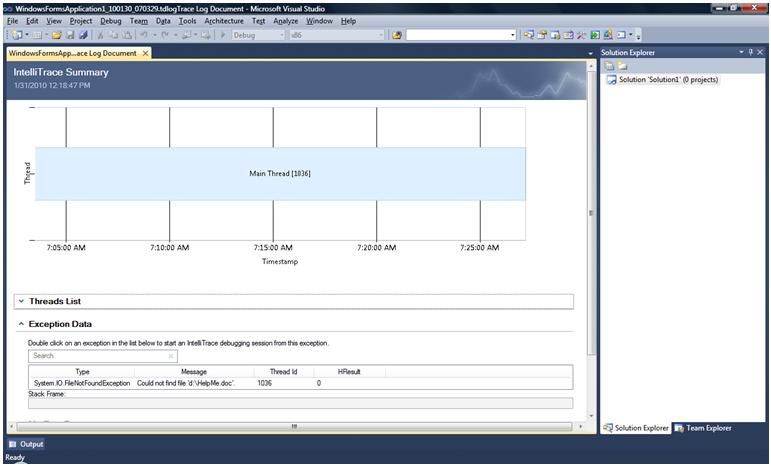
This graph contains the timestamp of the entire debug session along with the thread lists. If you expand, you will find all the threads listed:
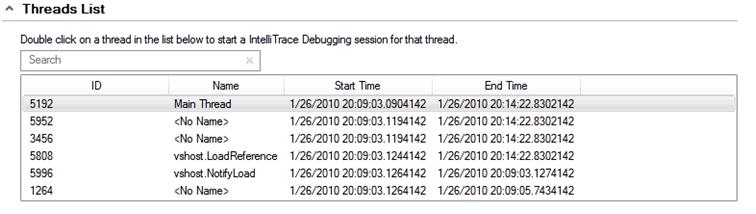
If you double-click any thread, the debugging session will start for that thread. You need to match the symbols and align the source to get the full advantage.
3. Tips
a. Navigation gutter not shown
The navigation bar or gutter is visible if you select the check box "Tools >Options>Intellitrace>Advanced>Display the navigation gutter" while in debug mode.
b. No source available
You need to make sure that the source code for the modules is available. If not, you will get the following error:
c. Intellitrace does not support Remote Debugging
So what happens if you attach the debugger to a remote process? You will not get Intellitrace support.
d. Intellitrace does not support debugging C++ Unmanaged/Mixed-Mode code
Currently, Intellitrace doesn't have the functionality to get a trace log for unmanaged code.
4. Summary
In short, Intellitrace will drastically change the debugging experience and help reduce the time reproducing bugs in our application. Let's start using it and enjoy.
!!!Happy Debugging!!!
- Prabhat Tandon