Data to collect for troubleshooting analysis services issue
We troubleshoot analysis services issue day in and day out J as integrated component of team foundation server(TFS) and got to know about an issue being handled by one of the engineers in our local team, so was fiddling around with my old notes in
one note and got hold of this information collected by me earlier.
P.S. Most of these logs (excluding dumps) are easily readable and you can use them for your own investigation.
General data:
1. msmdsrv.ini
The configuration file for the SSAS instance "msmdsrv.ini" can be found in the "\config" folder of the SSAS instance.
Typically something like "C:\Program Files\Microsoft SQL Server\MSAS10_50.MSSQLSERVER\OLAP\Config".
If you are unsure about the location, then have a look at the properties of the SSAS service under "services.msc".
The "path to executable" field will have the config file folder as "-s" startup parameter:
f.i.
"C:\Program Files\Microsoft SQL Server\MSAS10_50.MSSQLSERVER\OLAP\bin\msmdsrv.exe" -s "C:\Program Files\Microsoft SQL Server\MSAS10_50.MSSQLSERVER\OLAP\Config"
"msmdsrv.ini" contains the server properties in XML format. You should not edit it unless MS support asks you to do so. And even then do it very carefully.
The supported interface for changing instance properties is SQL Server Management Studio.
2. windows event logs
you can access them via "Administrative Tools" --> "Event Viewer". SSAS error messages will appear in the application log. System problems (memory, disk space) will appear in system log.
For problem analysis we are interested in both, system + application event log.
Please save them in .txt or .csv format in order to ensure that event resolution happens on the source server.
3. system information / msinfo32
This log gives us valuable information about your host machine setup. The number + type of CPUs, RAM size, page file size and lots of other hardware related
information.
Please save as system information file (.nfo) or export to text file.
4. msmdsrv.log
Optional.
The log file for the SSAS instance that can be found in \log folder of the instance (f.i. C:\Program Files\Microsoft SQL Server\MSAS10.MSSQLSERVER\OLAP\Log). For exact location check instance
properties in Management Studio or "msmdsrv.ini". Typically all the information in here should be available from application log as well.
But it does not hurt to double-check its content.
5. content of SSAS data folder
Optional.
Often it is also quite useful to have a look at the sizes of SSAS data files. An overview of SSAS data files in use can be created by execution the following
commands from command prompt :
cd <SSAS data folder> dir /s > datafiles.txt
data collection for special scenarios:
Depending on the problem area we will need to look at additional data. Here's a short list of the problem areas we typically observe.
A. setup issues
All setup related log files can be found in the "setup bootstrap" folder. Usually : "C:\Program Files\Microsoft SQL Server\100\Setup Bootstrap\Log"
The summary log will show you the general outcome of the setup operation and point you to log files that give more detail about the setup issue (if there was any).
When contacting Microsoft support please zip up the log folder + provide it to us.
B. cube design issues
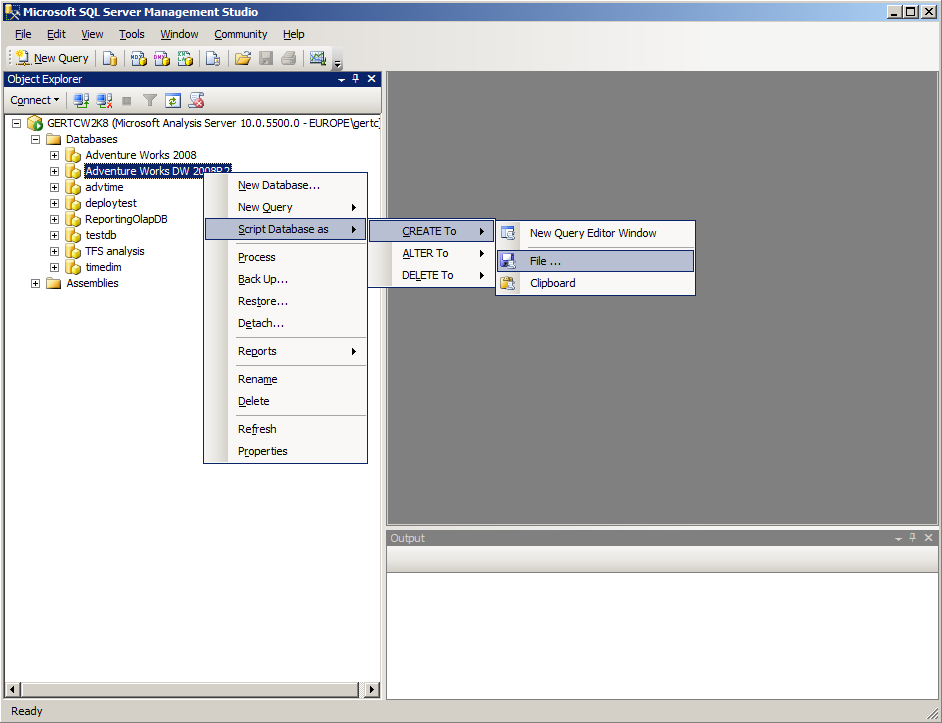
For cube design issues we will need to have a look at the meta data of your SSAS database. You can provide us with either the Visual Studio project or an XMLA script of your database.
The XMLA script can be generated in "Management Studio" by right-clicking the database icon -> script database as -> Create to -> File ...

internal errors /crashes /exceptions /hangs
SSAS automatically creates mini dumps (.mdmp) when it runs into exceptions or certain (configurable) errors.
For a detailed description of settings see:
919711 How to configure SQL Server 2005 Analysis Services to generate memory dump files
support.microsoft.com/default.aspx?scid=kb;EN-US;919711
This diagnostic information is very valuable to us and is created in the \log folder of the SSAS instance (f.i. C:\Program Files\Microsoft SQL Server\MSAS10_50.MSSQLSERVER\OLAP\Log).
Please collect the mini dumps (SQLDmprxxxx.mdmp) and the associated log files (SQLDmprxxxx.log) that are associated with your issue (time stamp of files!).
The SQLDUMPER_ERRORLOG.log records all mini dumps that have been created and can be useful as well.
For hang issues we may ask you to create "hang dumps" manually.
You can do this by using the "sqldumper.exe" utility as described in "How to generate a full dump file that includes handle information manually" section of KB 919711.
Full dumps (as big as SSAS memory foot print) can be created via "sqldumper.exe PID 0 0x34:0x4 0 PathToDumpFile" command.
Mini dumps (typically 100 - 300 MB) can be collected via "sqldumper.exe PID 0 0x120 0 PathToDumpFile" command.
performance issues / hangs
Performance issues are best analyzed with a combination of SQL profiler traces and performance counter logs.
Sometimes we may also need to create mini dumps manually (hang dumps).
SQL Server profiler:
Under the "sql server" program group and "performance tools" subheading you will find the "sql server profiler" tool.
Start it , select File -> new trace and connect to "server type" = "Analysis Services" + your SSAS instance name.
On the trace properties page make sure the Standard trace template is selected. You should also enable file rollover with a maximum file size of 200 MB.
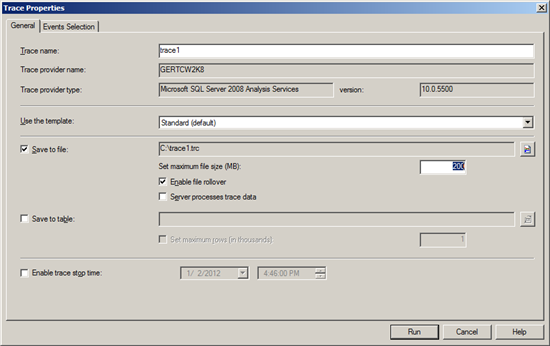
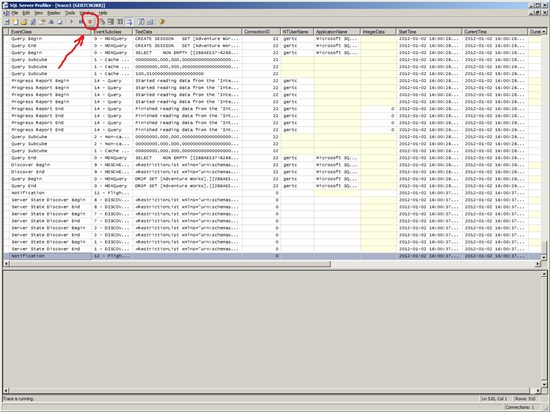
Hitting the run button will start the trace.
Hitting the red square button will stop it again.
Since SQL Server 2008 R2 Service Pack 1 we also have new "resource usage", "MDX script" and "Lock" events that may prove useful for troubleshooting performance issues:
2458438
FIX: SQL Server 2008 R2 Analysis Services introduces new trace events to track resource usage and locks by using SQL Server Profiler
support.microsoft.com/default.aspx?scid=kb;EN-US;2458438
If you are seeing a hang and suspect deadlock issues, then don't forget to include the deadlock event as well.
performance counter log:
The basics for performance counter log handling are described here: technet.microsoft.com/en-us/library/cc766404.aspx
For SSAS performance troubleshooting we need the OS counter groups
Memory (all counters)
Processor (allinstances, all counters)
Process (all instances, all counters) , sometimes we limit collection to msmdsrv and sqlservr process instances in order to reduce data volume
Logical disk (all instances, all counters)
Paging File (%usage)
In addition we need at least the following SSAS counter groups:
MSAS:Threads
MSAS:Memory
MSAS:Locks
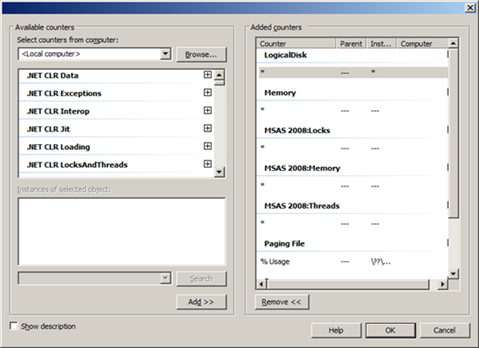
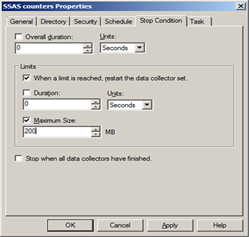
In the collector set properties you should select a 200 MB file rollover as indicated below:
"Repro"
When dealing with issues that need a very detailed analysis and/or that are hard to grasp we may ask you for a "repro". What this essentially means is that we want to reproduce the issue in our lab and need the data for doing so.
Typically this if reprocessing of the data is required or ROLAP data are involved, then we will likely need a backup of the relational source data as well.
Written by: Nitish Nagpal, Support Escalation Engineer
Reviewed by Analysis and Reporting Team