Collecting diagnostics for WCF (hosted in IIS) & Web Service performance related issues
Say for example you are troubleshooting a high CPU or a slow response or a hang issue. For diagnostics collect the following from the server side:
- IIS Logs (Location: %SystemDrive%\inetpub\logs\LogFiles)
- FREB traces (see steps below)
- PerfView traces (see steps below)
- Dumps of the IIS worker process (w3wp.exe) hosting your WCF or Web service, captured during the time of slowness. (see steps below on how to capture dumps)
- WCF & System.Net tracing (if the client is not a Web page but an application (Web, desktop or a service), you should collect these traces from the client as well.)
FREB
To configure FREB traces, go to IIS Manager, select your Web Site (hosting your WCF Services). On the right hand pane under Actions there is a Configure section; click Failed Request Tracing…
The trace should be enabled. See screen shot below: 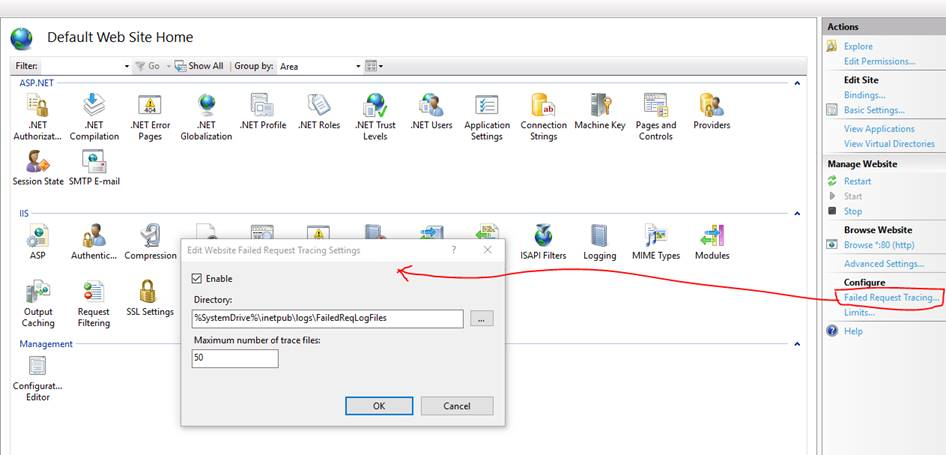
From the center pane, click at Failed Request Tracing… as shown below: 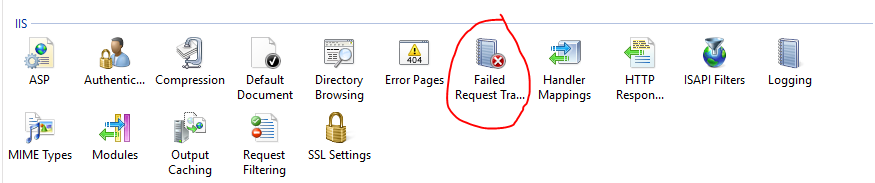
Click Add… as shown below and follow the dialog box. 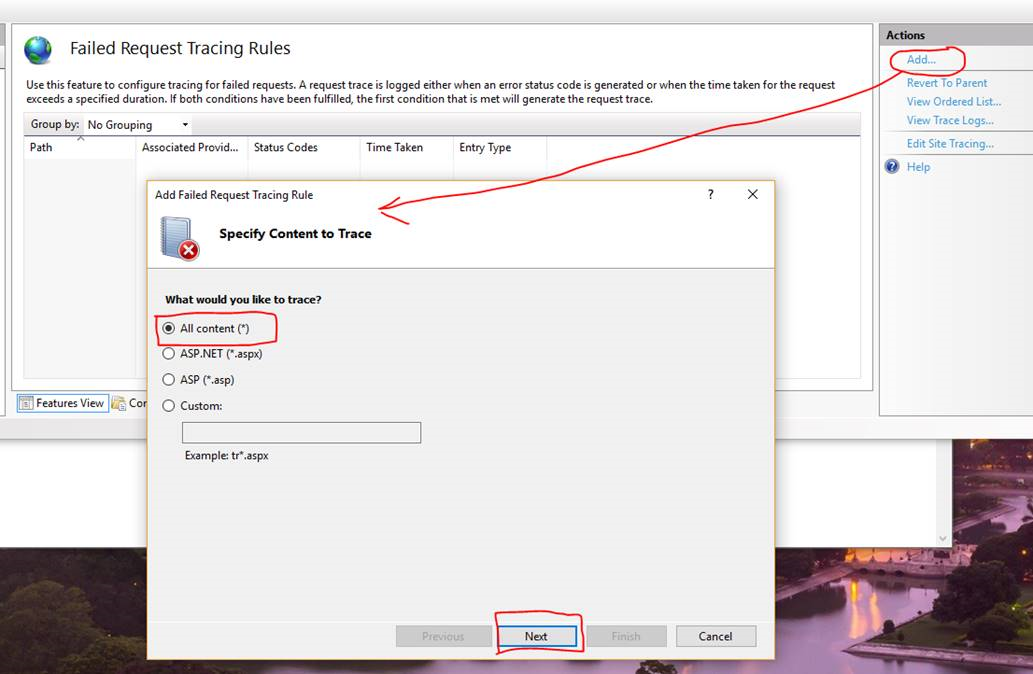
If you want to track by time, set it by checking Time taken and click Next. See screen shot below.
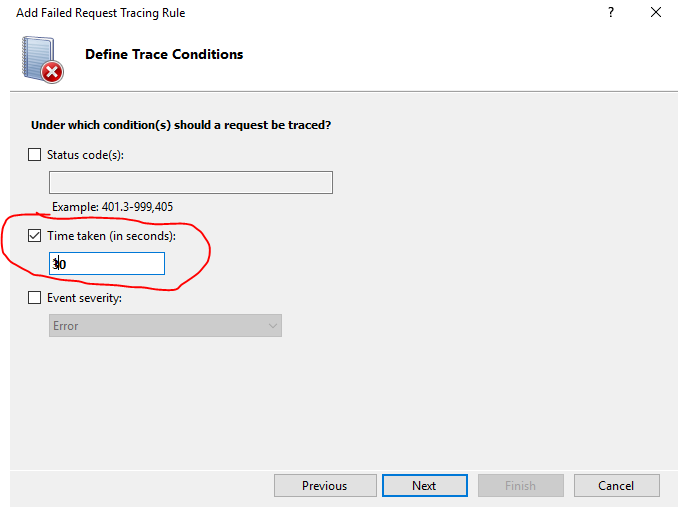
Alternatively (check any one, not both) you can track by Status code(s) , with values 200-999 & click Next to continue. See screen shot below. 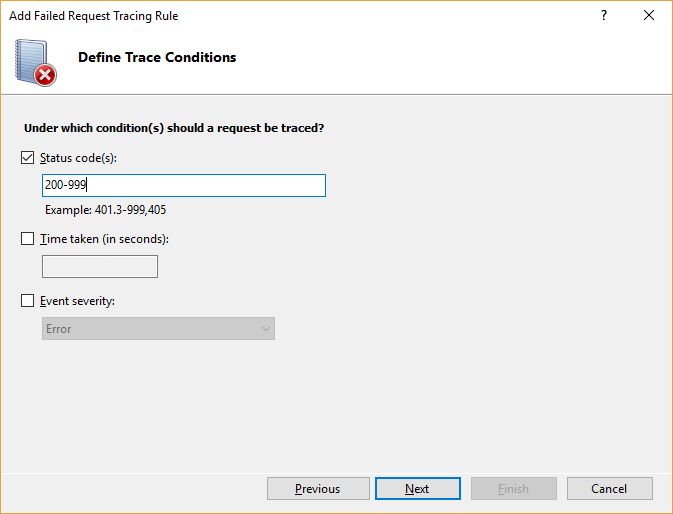
Click at Finish as shown in the dialog below. Please note: IIS reset is not required. 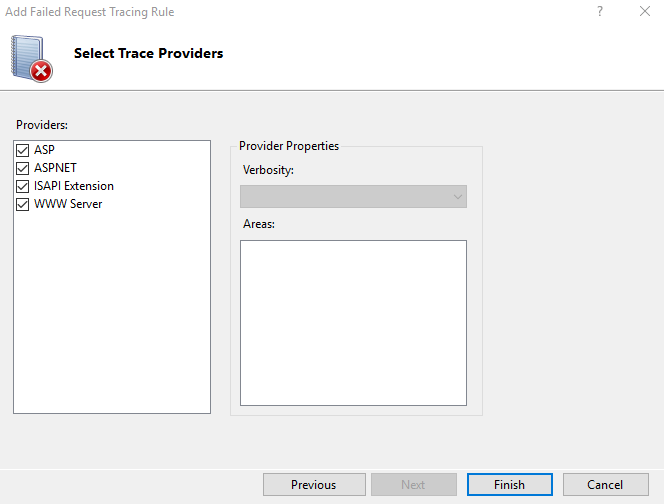
For PerfView & Debug Diagnostic steps see: https://blogs.msdn.microsoft.com/dsnotes/2016/12/30/capturing-full-user-mode-dumps-perfview-traces-for-troubleshooting-high-cpu-hang-issues/
WCF & System.Net tracing
Here is an example of a web.config file with WCF & System.Net tracing enabled. You need to integrate the sections highlighted in yellow within the correct sections highlighted in cyan.
You can directly use it on your web.config. In initializeData (see below), kindly set the correct path.
 <?xml version="1.0" encoding="UTF-8"?>
<configuration>
 <system.diagnostics>
    <sources>
       <source name="System.Net" switchValue="Verbose">
            <listeners>
                <add name="SystemNetTrace"/>
           </listeners>
       </source>
      <source name="System.ServiceModel" switchValue="Verbose, ActivityTracing" propagateActivity="true">
        <listeners>
          <add name="wcftrace" />
       </listeners>
      </source>
      <source name="System.ServiceModel.MessageLogging" switchValue="Verbose, ActivityTracing">
        <listeners>
          <add name="wcfmessages" />
        </listeners>
      </source>
      <source name="System.Runtime.Serialization" switchValue="Verbose">
        <listeners>
          <add name="wcfmessages" />
        </listeners>
      </source>
   </sources>
   <sharedListeners>
      <add name="SystemNetTrace" type="System.Diagnostics.TextWriterTraceListener" traceOutputOptions="LogicalOperationStack, DateTime, Timestamp, Callstack" initializeData="C:\Traces\System_Net.txt" />
      <add name="wcftrace" type="System.Diagnostics.XmlWriterTraceListener" traceOutputOptions="LogicalOperationStack, DateTime, Timestamp, Callstack" initializeData="C:\Traces\WCFTrace.svclog" />
      <add name="wcfmessages" type="System.Diagnostics.XmlWriterTraceListener" traceOutputOptions="LogicalOperationStack, DateTime, Timestamp, Callstack" initializeData="C:\Traces\WCFMessages.svclog" />
   </sharedListeners>
   <trace autoflush="true" />
  </system.diagnostics>
 </configuration>
If you by any chance is working with Microsoft support, send the following for a review or review it yourself to track the origin of slowness.
- IIS Logs - track calls which are taking time. Isolate WCF or Web Service calls taking time.
- FREB traces - Analyze them to see where the calls are stuck for example in the IIS integrated pipeline or somewhere else.
- WCF & System.Net traces - track for errors, exceptions & duration of the calls via the correlation ID.
- PerfView traces - you can track for thread times, ASP.NEt events, etc.
- Debug Diagnostic dumps - track for thread call-stacks, CPU usage, memory usage etc.