Identify memory leak for a process hosting ASMX/ WCF service
Problem statement
A good number of asmx web services are hosted on IIS application pool (4.0 | 64bit) over Windows server 2008 R2 SP1. It is observed the private bytes usage for the application pool climbs from 3 to 4 GB in around 1 hour.
Why are there so many allocations in such a quick span of time?
How to troubleshoot
Since application is hosted on IIS, the process of interest will be w3wp.exe. We have to treat it as a normal .net process troubleshooting where memory consumption is so high.
Action plan will be to enable perfmon counters for
- .NET CLR Memory/(*)
- Process/(*)
- .Net CLR Loading/(*)
How to identify if there is any memory leak? (Review)
- Remove all counters
- Select .NET CLR Memory/ # Bytes in all Heaps, Process/ Private Bytes counters for the process
The graph appears like below:
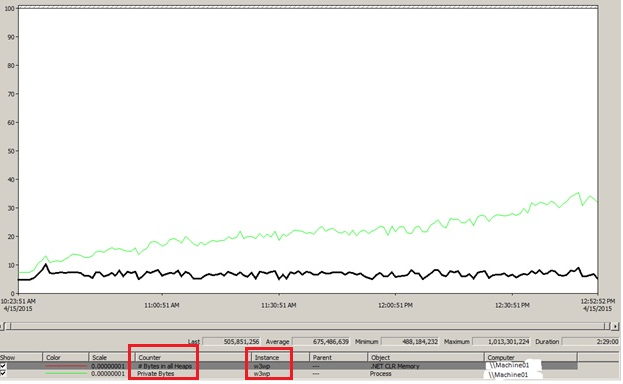
Observation (from the sampling)
- Perfmon data has been collected for around 2 hours.
- We see a pattern where private bytes for w3wp keeps growing at a certain rate. In comparison to it, #Bytes in all heaps graph stays almost flat.
- It is an indicative where there is a leak in the native modules.
Note
Private Bytes: "The current size, in bytes, of memory that this process has allocated that cannot be shared with other processes."
#Bytes in all heaps: "This counter is the sum of four other counters; Gen 0 Heap Size; Gen 1 Heap Size; Gen 2 Heap Size and the Large Object Heap Size. This counter indicates the current memory allocated in bytes on the GC Heaps."
How to troubleshoot native memory leak?
We need to get LeakTrack.dll injected memory dumps to troubleshoot further.
Steps
- Restart the w3wp process
- Make small number of requests to application
- Go to debugdiag tool (You can get the latest from www.microsoft.com/en-us/download/details.aspx?id=42933)
- Go to Processes tab
- Sort the "Process Name" column
- Find the w3wp (there will be application pool name mentioned in right to identify which w3wp process can be selected)
- Select the w3wp > Right click > Select "Monitor For leaks"
- Keep your application testing with high number of requests
- Monitor the private bytes in debugdiag
- When size grows to 2.2GB, right click and take a "Full user Memorydump"
- Second memory dump at 2.6GB size
- Third memory dump at 3.0GB size
- Once all dumps are collected, right click process and select "Stop monitoring"
Review
- Go to DebuDiag analysis
- Select MemoryAnalysis only
- Add Data Files > select the first dump file > Start Analysis
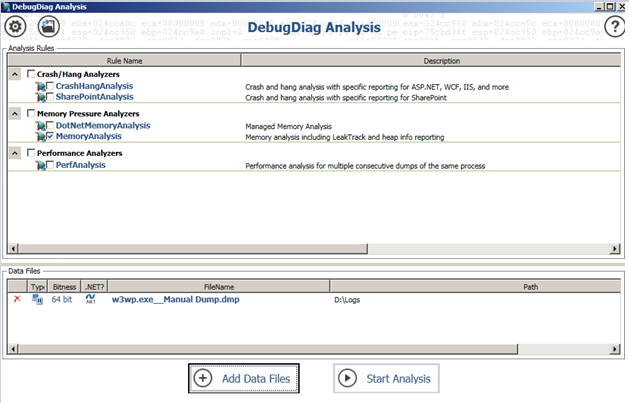
- It will generate reports for the dump file.
- We have to follow the same process for other 2 memory dumps as well respectively.
Dump 1
=============================
Number of outstanding allocations = 13,155 allocations (outstanding allocations means x number of allocations are done, but have been not freed up yet from memory)
Total outstanding handle count = 469 handles
Total size of allocations = 1.68 GBytes
Tracking duration = 01:39:09
GdiPlus
Module Name GdiPlus
Allocation Count 1370 allocation(s)
Allocation Size 1.17 GBytes
Top function
GdiPlus!GpMemoryBitmap::AllocBitmapData+c2 with 155 allocations takes 1.16GB of memory space
Dump 2
============================
Number of outstanding allocations = 13,150 allocations
Total outstanding handle count = 541 handles
Total size of allocations = 2.14 GBytes
Tracking duration = 02:01:34
GdiPlus
Module Name GdiPlus
Allocation Count 1783 allocation(s)
Allocation Size 1.63 GBytes
Top function
GdiPlus!GpMemoryBitmap::AllocBitmapData+c2 with 220 allocations takes 1.62GB of memory space
Dump 3
==============================
Number of outstanding allocations = 12,862 allocations
Total outstanding handle count = 493 handles
Total size of allocations = 2.7 GBytes
Tracking duration = 02:26:05
GdiPlus
Module Name GdiPlus
Allocation Count 2283 allocation(s)
Allocation Size 2.19 GBytes
Top function
GdiPlus!GpMemoryBitmap::AllocBitmapData+c2 with 290 allocations takes 2.17GB of memory space
In dump 3 case, the size of memory dump is 3.16GB. Out of which, 2.19GB GdiPlus module allocations are done in around 2 and half hours.
Now, it is safe to say the overall leak is because of GdiPlus module, but why?
Does the web service utilize any GdiPlus APIs for its web methods?
Let us identify.
How to?
We need to watch for callstacks in the captured memory dumps.
An example:
0:057> kL
# Child-SP RetAddr Call Site
00 00000000`0b99a320 000007fe`fbbfcb6b GdiPlus!GpRecolorObject::ColorAdjust+0x28d
01 00000000`0b99a360 000007fe`fbbfca82 GdiPlus!GpRecolorOp::Run+0x2b
02 00000000`0b99a390 000007fe`fbbf885b GdiPlus!GpBitmapOps::PushPixelData+0x182
03 00000000`0b99a400 000007fe`fbbf7ac8 GdiPlus!GpMemoryBitmap::PushIntoSink+0x267
04 00000000`0b99a530 000007fe`fbafa21b GdiPlus!GpMemoryBitmap::InitImageBitmap+0x290
05 00000000`0b99a600 000007fe`fbafa006 GdiPlus!CopyOnWriteBitmap::PipeLockBitsFromMemory+0xd3
06 00000000`0b99a690 000007fe`fbaff0fa GdiPlus!CopyOnWriteBitmap::PipeLockBits+0x5ea
07 00000000`0b99a810 000007fe`fbb28c23 GdiPlus!GpBitmap::PipeLockBits+0x6e
08 00000000`0b99a840 000007fe`fbb23f75 GdiPlus!GpGraphics::DrvDrawImage+0x287b
09 00000000`0b99b0b0 000007fe`fbb2360b GdiPlus!GpGraphics::DrawImage+0x86d
0a 00000000`0b99b260 000007fe`fbae2a82 GdiPlus!GpGraphics::DrawImage+0xb7
0b 00000000`0b99b2f0 000007fe`fbae2c48 GdiPlus!GdipDrawImageRectRect+0x362
0c 00000000`0b99b3f0 000007fe`f99117c7 GdiPlus!GdipDrawImageRectRectI+0xfc
0d 00000000`0b99b490 000007fe`dd41d439 clr!DoNDirectCall__PatchGetThreadCall+0x7b
0e 00000000`0b99b580 000007fe`dd416da4 System_Drawing_ni!DomainNeutralILStubClass.IL_STUB_PInvoke(System.Runtime.InteropServices.HandleRef, System.Runtime.InteropServices.HandleRef, Int32, Int32, Int32, Int32, Int32,
Int32, Int32, Int32, Int32, System.Runtime.InteropServices.HandleRef, DrawImageAbort, System.Runtime.InteropServices.HandleRef)+0x179
0f 00000000`0b99b6f0 000007fe`dd4e95f9 System_Drawing_ni!System.Drawing.Graphics.DrawImage(System.Drawing.Image, System.Drawing.Rectangle, Int32, Int32, Int32, Int32, System.Drawing.GraphicsUnit, System.Drawing.Imaging.ImageAttributes, DrawImageAbort, IntPtr)+0x264
10 00000000`0b99b850 000007fe`dd418ce1 System_Drawing_ni!System.Drawing.Graphics.DrawImage(System.Drawing.Image, System.Drawing.Rectangle, Int32, Int32, Int32, Int32, System.Drawing.GraphicsUnit, System.Drawing.Imaging.ImageAttributes, DrawImageAbort)+0x99
12 00000000`0b99b960 000007ff`010148fe MyDrawing!MyDrawing.GdiPlusCanvas.BitmapToMonochrome(System.Drawing.Bitmap)+0x2da
13 00000000`0b99ba50 000007ff`01006b5d MyDrawing!MyDrawing.GdiPlusCanvas.GetImageBytes(System.Drawing.Imaging.ImageFormat, Boolean)+0x6e
14 00000000`0b99bad0 000007ff`01006329 MyDrawing!MyDrawing.BaseForm._GetOutput(Drawing.CanvasBase, FormOutputFormat, Int32, Rotation, OutputMode, PdfSettings, Boolean, Boolean)+0xcd
16 00000000`0b99c410 000007ff`00d90392 MyService_Core!MyService.Controller.Create(MyService.Request, MyService.Core.RequestResponse, Account, Boolean, SoftwareID)+0x7da
18 00000000`0b99c6a0 000007ff`00d7c986 MyService!MyService.GetImagesInternal(System.Object, MyService.Core.Request ByRef)+0x38f
19 00000000`0b99c760 000007ff`00d7c7a7 MyService!MyService.WebServiceBase.ExecuteWebMethod[[System.__Canon, mscorlib]](System.Func`1<System.__Canon>, MyService.WebMethodParams)+0x96
1a 00000000`0b99c800 000007fe`f994c9e4 MyService!MyService.GetCommonImages(System.Object)+0xa7
..
4a 00000000`0b99ee50 000007fe`f9adc736 clr!ThreadpoolMgr::WorkerThreadStart+0x3b
4b 00000000`0b99eef0 00000000`773359ed clr!Thread::intermediateThreadProc+0x7d
4c 00000000`0b99feb0 00000000`7756c541 kernel32!BaseThreadInitThunk+0xd
4d 00000000`0b99fee0 00000000`00000000 ntdll!RtlUserThreadStart+0x1d
Observation (from callstack above)
1. We see like asmx service APIS call System.Drawing APIs (The System.Drawing namespace provides access to GDI+ basic graphics functionality)
2. It seems graphics APIs like System.Drawing are not supported in asp.net service components. The web link which talks about the same and where alternatives are discussed:
https://msdn.microsoft.com/en-us/library/system.drawing(v=vs.110).aspx
3. The primary cause of this memory leak is usage of System.Drawing GDI+ APIs in web services.
General tips
1. If virtual bytes jump, private bytes stay flat
=> A virtual byte leak i.e. some component is reserving memory but not using it
=> Use debug diag to track it down
2. If private bytes jump but #Bytes in all heaps stay flat
=> Native or loader heap leak.
=> Use debug diag to track it down and/or check if the number of assemblies increase (counter under .net clr loading)
3. #Bytes in all heaps and private bytes follow each other
=> investigate the .net GC heap
Hope this helps!