Way to troubleshoot memory leak using performance monitor and UMDH
Please refer to support.microsoft.com/kb/268343 to know every detail about using UMDH and analyzing UMDH logs.
The article below is a basic example to show how to analyze memory leak using performance monitor and UMDH.
Steps to use UMDH are:
- Install the UMDH utility. (UMDH utility is included with the Debugging Tools for Windows.)
- Set the system PATH environment variable to include the folder where you installed UMDH.
- Set _NT_SYMBOL_PATH environment variable. For Example: Set _NT_SYMBOL_PATH = symsrv*symsrv.dll*C:\localsymbols*msdl.microsoft.com/download/symbols
- Enable gflags. Example: gflags -i YourApplication.exe +ust
- Run UMDH command. Example: UMDH –p:<PID> -f: YourLog.log
Ideally performance monitor logs should be gathered and should include the private bytes. Ideally it is good to collect the following counters:
- Private bytes
- Virtual Bytes
- Working Set – Private
Here is a typical example of analyzing performance monitor and UMDH logs.
Analyzing performance monitor logs
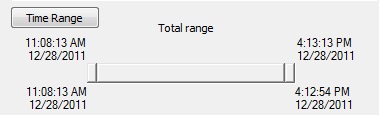
Figure 1: The time range which is 5 hours and 5 minutes for which the performance monitor and UMDH logs were collected.
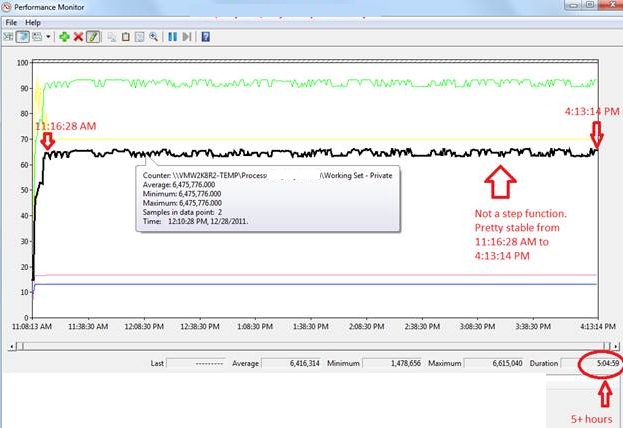
Figure 2: Black line highlighted above shows the working set private bytes for the process. It is not a step function of time. At 11:16:28 AM it gets to a stable state after which we cannot see any steep rise either in the private bytes or in the working set private bytes.
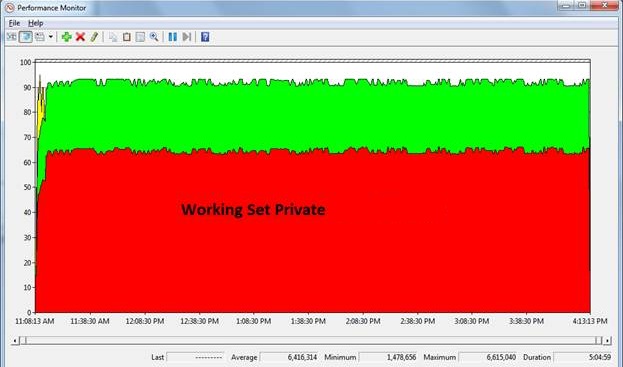
Figure 3: Area view of the working set private bytes and private bytes for the process – Not a step function.
Take another set of performance logs. The analysis is shown below:
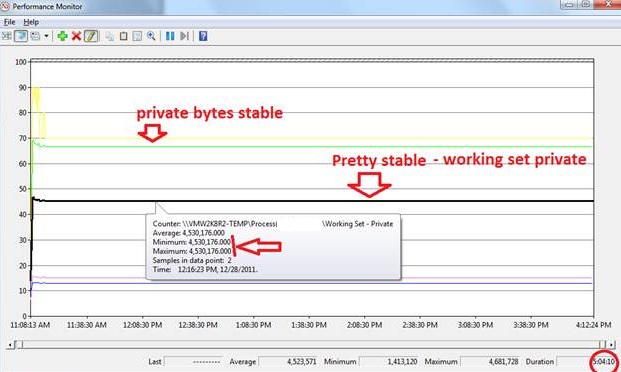
Figure 4: Private bytes and working set private for the process – showing a horizontal line without any change.
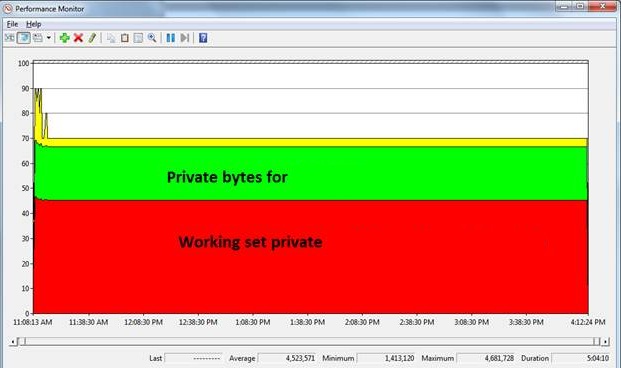
Figure 5: Area view for working set private bytes and private bytes for the process.
UMDH Analysis
Consider two logs Log1.log and Log2.log captured at different intervals of time. A way to compute the difference is shown below:
UMDH –d Log1.log Log2.log > CMP12.txt
The -d command line option tells UMDH to display in decimal instead of hexadecimal. The output of the command compares the differences of the allocations between the two logs and provides information that is similar to the following:
+ 5320 ( f110 - 9df0) 3a allocs BackTrace00053 Total increase == 5320
The "5320" is the difference in the number of bytes allocated. In this case, there were 0x5320 more bytes allocated between the times that the two logs were captured. The bytes came from the call-stack that is identified by "BackTrace00053".
Let us now see the comparison logs for the process on which UMDH logs have been collected.
There were 5 UMDH logs collected at a certain interval of time. They are:
- Test-n0.log
- Test-n1.log
- Test-n2.log
- Test-n3.log
- Test-n4.log
We made a cumulative comparison of the logs. See below:
Command run: Umdh.exe -d Test-n0.log Test-n1.log > CMP01.txt
Total increase == 493610 requested + 125590 overhead = 619200
Overheads: 125590 bytes = 0.12 MB.
Command run: Umdh.exe -d Test-n1.log Test-n2.log > CMP12.txt
Total decrease == 0 requested + 0 overhead = 0
No overheads.
Command run: Umdh.exe -d Test-n2.log Test-n5.log > CMP25.txt
Total decrease == 0 requested + 0 overhead = 0
No overheads.
This matches the results shown by the performance monitor logs (Figure 4 and Figure 5). There is a sudden steep rise in the working set private (as the process allocates memory) and with the passage of time the overheads gets reduced to 0, which means “no leak”.
There were 5 more UMDH logs for the same process collected at a different time and at different intervals of time. They are:
- 2ndTest-r0.log
- 2ndTest-r1.log
- 2ndTest-r2.log
- 2ndTest-r3.log
- 2ndTest-r4.log
Command run: Umdh.exe -d 2ndTest-r0.log 2ndTest-r1.log > 2ndCMP01.txt
Total increase == 551954 requested + 128126 overhead = 680080
Overheads: 128126 bytes = 0.12 MB.
Command run: Umdh.exe -d 2ndTest-r1.log 2ndTest-r2.log > 2ndCMP12.txt
Total increase == 24 requested + 168 overhead = 192
Overhead: 168 bytes = 0.00016 MB.
Command run: Umdh.exe -d 2ndTest-r2.log 2ndTest-r3.log > 2ndCMP23.txt
Total increase == 68 requested + 476 overhead = 544
Overhead: 476 bytes = 0.00052 MB.
This +/- 0.0005 MB allocations can be interpreted from the performance monitor logs shown below:
There has never been a steep rise in the private bytes from 11:15:28 AM till the end which can be interpreted as “no-leak”.
This is just an example to show how to use UMDH and performance monitor logs for analyzing memory leak.
Reference: support.microsoft.com/kb/268343
By Shamik Misra, Escalation Services, DSI Distributed Services