
.NET Core Performance Profiling with Intel® VTune™ Amplifier 2018
Last Updated: 2018-04-30
This post was written by Varun Venkatesan, Li Tian, and Juan Rodriguez, engineers at Intel. They are excited to share .NET Core-specific enhancements that Intel has made to VTune Amplifier 2018. We’re excited to have a new tool to use to help make .NET Core faster on Intel chips.
Intel has been a strong partner in the development and advancement of Microsoft’s .NET ecosystem, starting with our co-sponsorship (along with Hewlett-Packard) of the ECMA TC39/TG3 Common Language Infrastructure standardization process; through co-developing and optimizing several .NET Framework releases for scalability and performance; and moving into a new phase of investment in cross-platform, open source .NET for our joint customers.
Our objective is to ensure .NET delivers the best power/performance, scalable, and robust experiences on Intel Architecture. If you are a .NET Core developer who is interested in understanding how efficient your managed code execution is at a processor architecture/micro-architecture level, then read on.
Executive Summary
Intel® VTune™ Amplifier 2018 was released in September 2017 and includes a preview feature for profiling Just-In-Time (JIT) compiled .NET Core code on Microsoft Windows* and Linux* operating systems. Note that previous versions of VTune Amplifier supported profiling of JIT compiled code for .NET Framework. This blog is intended to help developers identify and fix performance bottlenecks in their .NET Core applications using this preview feature. We also present some real-world scenarios where we used VTune Amplifier to identify performance issues.
Note that VTune is a commercial product. In some cases, you may be eligible to obtain a free copy of VTune under specific terms. To see if you qualify, please refer to https://software.intel.com/en-us/qualify-for-free-software.
Update: VTune Amplifier 2018 Update 2 is now available and includes full feature support for Advanced Hotspots analysis for .NET Core applications running on Linux and Windows systems in the Launch Application mode. The environment variables used in prior releases to enable this as a preview feature are no longer needed. Additional info available in the below instructions.
Background
Developers using previous versions of VTune Amplifier for profiling their .NET Core applications would observe unresolved managed modules and functions, as shown in the figure below.

VTune Amplifier 2018 addresses this issue and also provides assembly-level hot spots for managed functions.
Here is the software configuration we have used for this blog:
- Windows Server 2016 version 1607 (we validated on Windows 10 Pro version 1607 too)
- Ubuntu* 14.04 (we validated on Ubuntu 16.04 too)
- .NET Core 2.0
Native profiling with VTune Amplifier on macOS* is not currently available.
Profiling .NET Core application on Windows
This section shows how to use VTune Amplifier 2018 to profile a sample .NET Core application on Windows.
- Install VTune Amplifier 2018.
- Install the .NET Core 2.0 SDK.
- Open a new command window for the dotnet environment variables to take effect. Make sure that .NET Core 2.0 was successfully installed with “dotnet –version”.
- Run the command “dotnet new console -o listadd” to create a new skeleton project with the following structure:
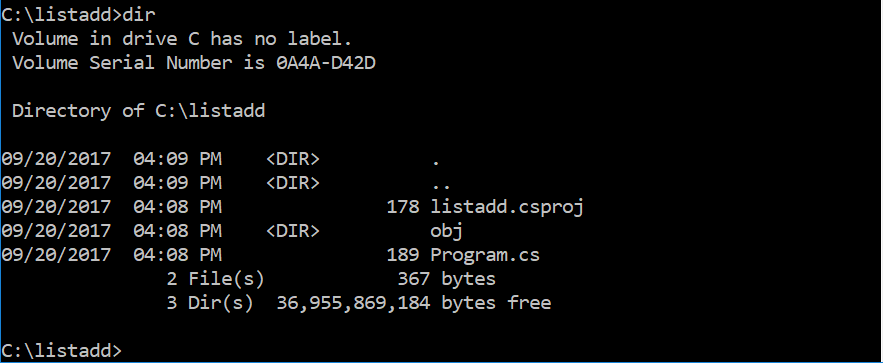
- We will replace the contents of Program.cs in the “listadd” folder with C# code that adds the elements of an integer List, available here.
- Add the following flag to the PropertyGroup section of the csproj file to enable Source-Assembly mapping in VTune Amplifier (currently available only for Windows):
<DebugType>pdbonly</DebugType>
- Run the command “dotnet build –c Release” to create “dll” in the “C:listaddbinReleasenetcoreapp2.0” folder.
- Now run the sample app: dotnet C:listaddbinReleasenetcoreapp2.0listadd.dll

- Next let’s use VTune Amplifier 2018 to profile the sample app. First, create a file called “environment.cmd” with the following contents:
set CORECLR_ENABLE_PROFILING 1
set CORECLR_PROFILER {AA5E4821-E3B1-479c-B7FF-5AD047D22CED}
Run the command “environment.cmd” to setup the environment for VTune Amplifier.
Note: You can also set system level environment as below instead of calling “environment.cmd” each time
setx CORECLR_ENABLE_PROFILING=1
setx CORECLR_PROFILER={AA5E4821-E3B1-479c-B7FF-5AD047D22CED}
When this preview feature becomes generally available in future VTune Amplifier releases, this environment setting will no longer be needed.
Update: The above environment variables (CORECLR_ENABLE_PROFILING & CORECLR_PROFILER) no longer need to be set as of VTune 2018 Update 2.
- Launch VTune Amplifier with administrator privileges.
- Create a new project, right-click the project name and then select “New Analysis”.
- Use the “Launch Application” mode as the target type in the “Analysis Target” tab. Fill up the “Application” and “Application parameters” fields:
- Application: C:Program Filesdotnetdotnet.exe
- Application Parameters: C:listaddbinReleasenetcoreapp2.0listadd.dll
Note: The location of dotnet.exe in the above may need to be changed to reflect one’s own environment and can be found with “where dotnet”.
- Click “Choose Analysis”.
- Select “Advanced Hotspots” mode under “Algorithm Analysis” in the “Analysis Type” tab.
- Click “Start”.
- After data collection is completed, select the “Bottom-up” tab. Then select “Process/Module/Function/Thread/Call Stack” in the Grouping drop-down.

- Expand “exe” and then “listadd.dll”. This will display the managed function in our sample application – “ListSample::Program::ListAdd”.

- Double-click the “ListSample::Program::ListAdd” function. The source-level profile would be displayed by default.
- To view the source and assembly profiles side-by-side, click on the “Assembly” button at the top. Developers could then look at snippets of code contributing the most to overall time and work on optimizing their code.
Profiling .NET Core application on Linux
This section shows how to use VTune Amplifier 2018 to profile a sample .NET Core application on Linux.
- Install VTune Amplifier 2018.
- Install the .NET Core 2.0 SDK.
- Make sure that .NET Core 2.0 was successfully installed with “dotnet –version”.
- Run the command “dotnet new console -o listadd” to create a new skeleton project with the following structure:

- Then replace the contents of Program.cs in the “listadd” folder with C# code that adds the elements of an integer List, available here.
- Run the command “dotnet build -c Release” to create “dll” in the “~/listadd/bin/Release/netcoreapp2.0” folder.
- Now run the sample app: dotnet ~/listadd/bin/Release/netcoreapp2.0/listadd.dll

- Next let’s use VTune Amplifier 2018 to profile the sample app. First, create a file called sh with the following contents:
echo 0 | sudo tee /proc/sys/kernel/watchdog echo 0 | sudo tee /proc/sys/kernel/yama/ptrace_scope echo 0 | sudo tee /proc/sys/kernel/kptr_restrict export AMPLXE_EXPERIMENTAL=coreclr cd /opt/intel/vtune_amplifier sudo –sh `source amplxe-vars.sh; amplxe-gui`
Run the command “chmod +x environment.sh” followed by “./environment.sh” to launch VTune Amplifier with sudo privileges.
Note: When this preview feature becomes generally available in future VTune Amplifier releases, the environment setting will no longer be needed.
Update: The above environment variable (AMPLXE_EXPERIMENTAL) no longer needs to be set as of VTune 2018 Update 2.
- Create a new VTune Amplifier project. Right-click the project and select “New Analysis”.
- Use the “Launch Application” mode as the target type in the “Analysis Target” tab. Fill up the “Application” and “Application parameters” fields:
- Application: /usr/bin/dotnet
- Application Parameters: /home/perftest/listadd/bin/Release/netcoreapp2.0/listadd.dll
Note: The location of dotnet and listadd.dll in the above may need to be changed to reflect one’s own environment. The location of dotnet can be found with “which dotnet”.
- Click “Choose Analysis”.
- Select “Advanced Hotspots” mode under “Algorithm Analysis”:
- Click “Start”.
- After data collection is completed, select the “Bottom-up” tab. Then select “Process/Module/Function/Thread/Call Stack” in the Grouping drop-down.

- Expand “dotnet” and then “dll”. This will display the managed function in our application – “Program::ListAdd”.

- Double-click the “Program::ListAdd” function. A prompt to search for sources is displayed. Source-Assembly mapping is not yet enabled for Linux. Just select “Show Assembly” to look at JIT generated code. Developers could then investigate snippets of code contributing the most to overall time and work on optimizing their code.
Real-world scenarios
Scenario 1: C# optimizations
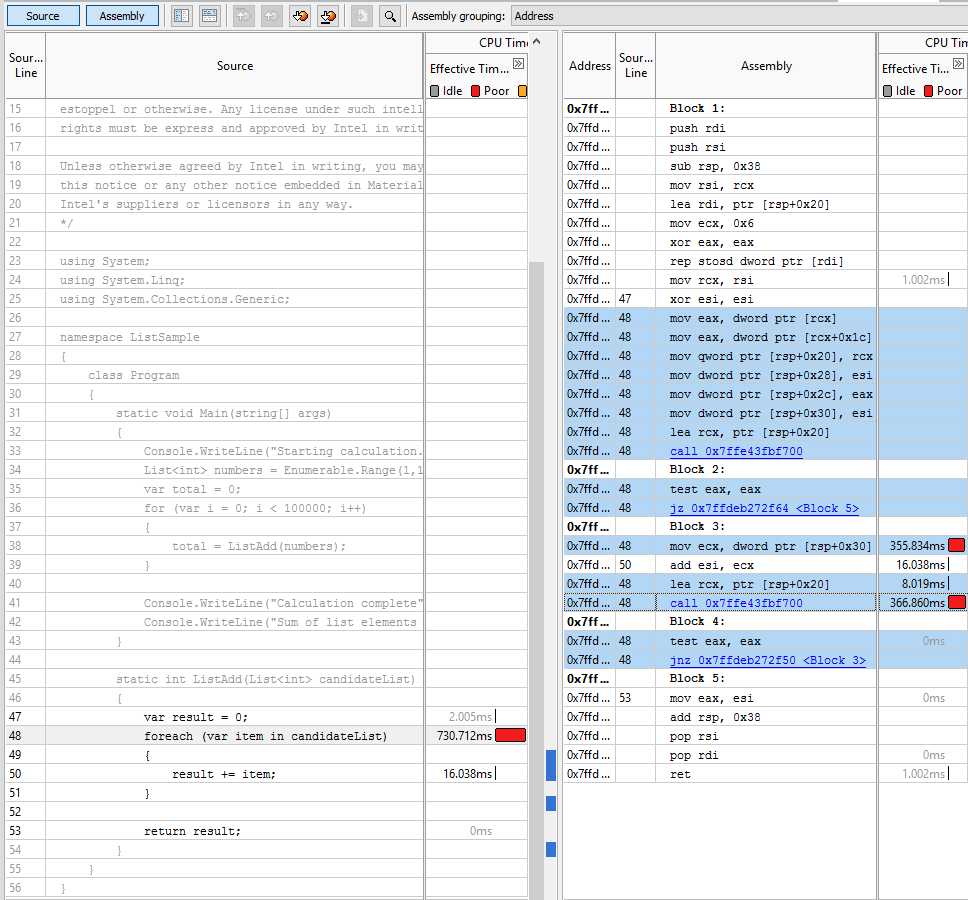
Let’s start with the C# sample application referenced in the above instructions. VTune Amplifier shows that majority of the CPU time is spent on the following statement:
foreach (int item in candidateList)
This can be optimized to use a for loop statement instead to avoid the overhead of enumerators, as explained here. Replace the contents of Program.cs with the C# code available here.
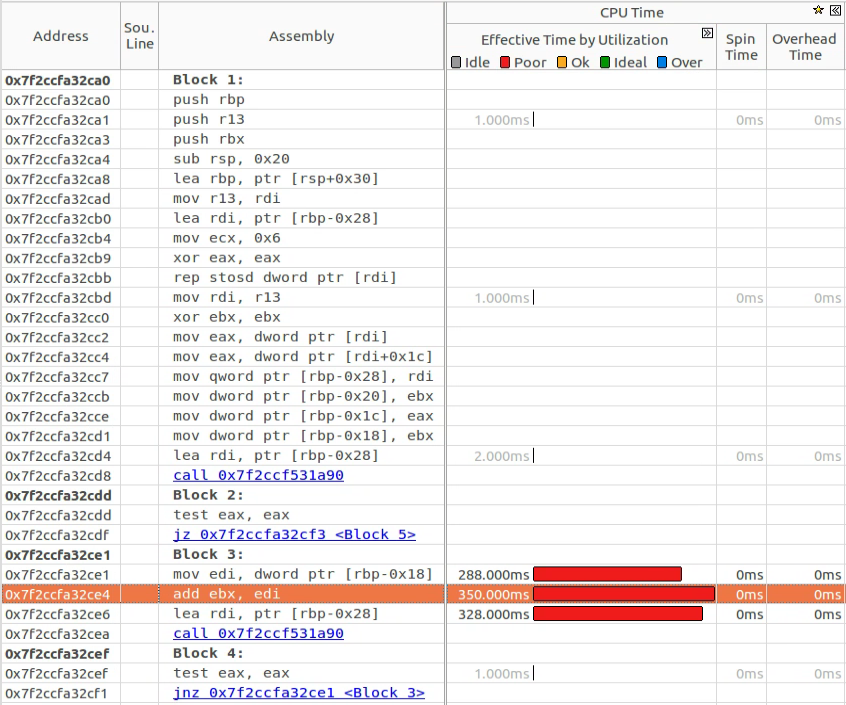
We profiled the sample application with VTune Amplifier before and after the above change. The application ran for 2.667s1 before the change:

The application ran for 0.924s1 after the change, leading to a 65% reduction in time over the original by avoiding the enumerator.

The above is a simple illustration of how VTune Amplifier can be used to optimize .NET Core applications. Now let’s take a look at a real world scenario where we used VTune Amplifier to optimize .NET Core.
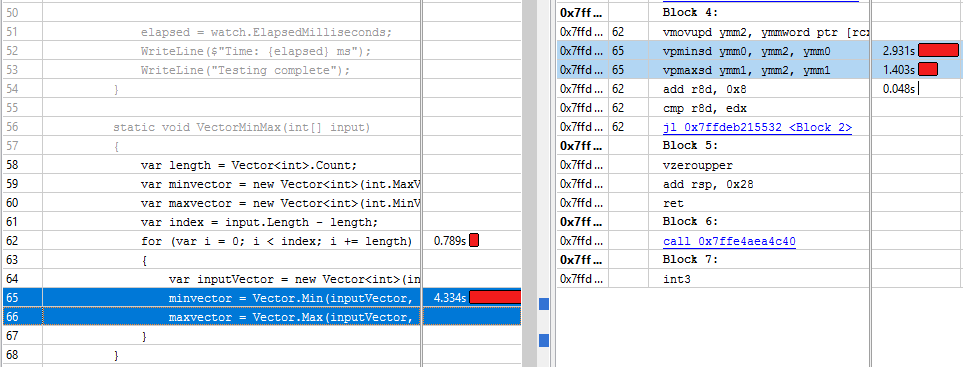
Scenario 2: Vector Min Max optimizations
Let’s now look at a sample application that exercises Vector Min/Max operations, available here. We used VTune Amplifier for performance analysis to ensure JIT code quality.
Here is the source-assembly mapping for Vector.Min and Vector.Max:

We noticed that the JIT code is not efficient because the Intel® Advanced Vector Extensions (Intel® AVX) form of the integer min/max instructions introduced in Intel® Streaming SIMD Extensions 4.1 (Intel® SSE4.1) were not being used. We added this support for the Vector<T> Min/Max intrinsic which led to more efficient code generation. Based on this work, we submitted a PR to CoreCLR, which was later merged, resulting in improved Vector<T> code quality.
Here is the source-assembly mapping for Vector.Min & Vector.Max after our PR has been merged to the .NET Core repository:
The application ran for 8.189s2 before our PR:

The application ran for 5.353s2 after our PR, leading to a 35% reduction in time over the original due to more efficient code generation:

.NET developers can use VTune Amplifier to uncover similar performance bottlenecks in their applications.
Summary
The preview feature of VTune Amplifier 2018 for .NET Core JIT code profiling helps developers quickly locate performance hot spots in their applications and significantly improves developer productivity resulting in quick turn-around for optimizing their applications.
References
VTune Amplifier Product page: https://software.intel.com/en-us/intel-vtune-amplifier-xe
For more details on using the VTune Amplifier, see the product online help.
For more complete information about compiler optimizations, see our Optimization Notice.
No license (express or implied, by estoppel or otherwise) to any intellectual property rights is granted by this document.Intel disclaims all express and implied warranties, including without limitation, the implied warranties of merchantability, fitness for a particular purpose, and non-infringement, as well as any warranty arising from course of performance, course of dealing, or usage in trade.
This document contains information on products, services and/or processes in development. All information provided here is subject to change without notice. Contact your Intel representative to obtain the latest forecast, schedule, specifications and roadmaps.
The products and services described may contain defects or errors known as errata which may cause deviations from published specifications. Current characterized errata are available on request.
Copies of documents which have an order number and are referenced in this document may be obtained by calling 1-800-548-4725 or by visiting www.intel.com/design/literature.htm.
Intel, the Intel logo, Xeon, VTune Amplifier are trademarks of Intel Corporation in the U.S. and/or other countries.
*Other names and brands may be claimed as the property of others
© Intel Corporation.
§ (1) As measured by using the VTune Amplifier on the ListAdd application provided in this document § Software and workloads used in performance tests may have been optimized for performance only on Intel microprocessors. Performance tests, such as SYSmark and MobileMark, are measured using specific computer systems, components, software, operations and functions. Any change to any of those factors may cause the results to vary. You should consult other information and performance tests to assist you in fully evaluating your contemplated purchases, including the performance of that product when combined with other products. § Configurations: Ran VTune Amplifier with the ListAdd sample on an Intel® server powered by Intel(R) Xeon(R) Platinum 8170 CPU @2.1GHz with 192 GB RAM running Windows Server 2016 § For more information go to www.intel.com/benchmarks
 Light
Light Dark
Dark
0 comments