Troubleshoot SQL Query Performance Issues Using QUERY STORE
Hello all,
Query Store is a very powerful SQL engine feature available in SQL 2016 designed to deliver insight into query performance (query text, query plan, runtime stats) by keeping track of different plans and execution statistics for the queries executed on the server.
This blog covers the steps to troubleshoot/monitor the SQL Server queries using SQL Query data store (QDS).
How it works:
- Once turned on, Query store collects all queries passing through the system.
- Query Store size has an upper bound. Once it fills up, it moves to Read Only mode automatically.
- Query Store data can be used to force specific query execution plans. If a plan is forced for a query, it will be enforced until determined by user action, even after SQL is restarted.
Checklist steps to use Query Store to troubleshoot SQL Performance Issues:
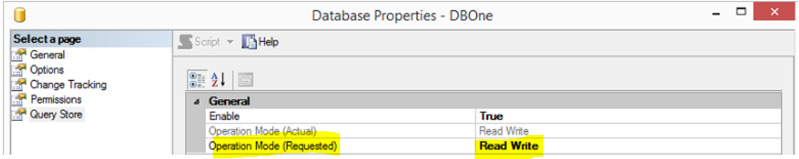
1. Monitoring Query store requires at least SQL Server 2016 version of Management Studio. Ensure that the Query Store Feature is enabled on the Application database and ensure that the query store state is “Read Write”.
Go to Database Properties Window and select Query store. Operation Mode (Requested) should be set to “Read Write”
Execute the below query to validate important query store attributes:
Use [DBname]
go
SELECT actual_state_desc, desired_state_desc, current_storage_size_mb,
max_storage_size_mb, readonly_reason
FROM sys.database_query_store_options;
The output of the above query should be as below:
Actual_state_desc: READ_WRITE
Desired_state_desc: READ_WRITE
Readonly_reason : 0
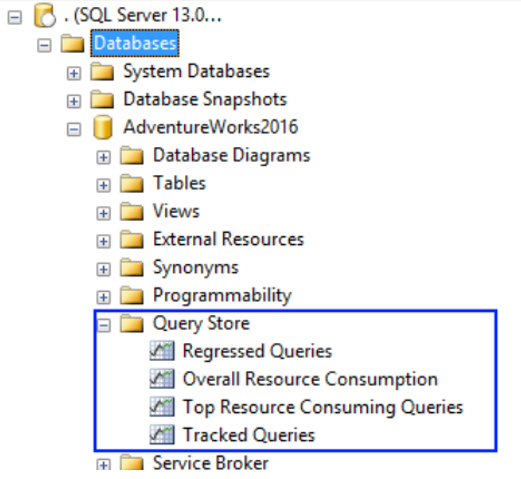
2. Check if the below query store views are visible in Query Store sub-folder under the database node.
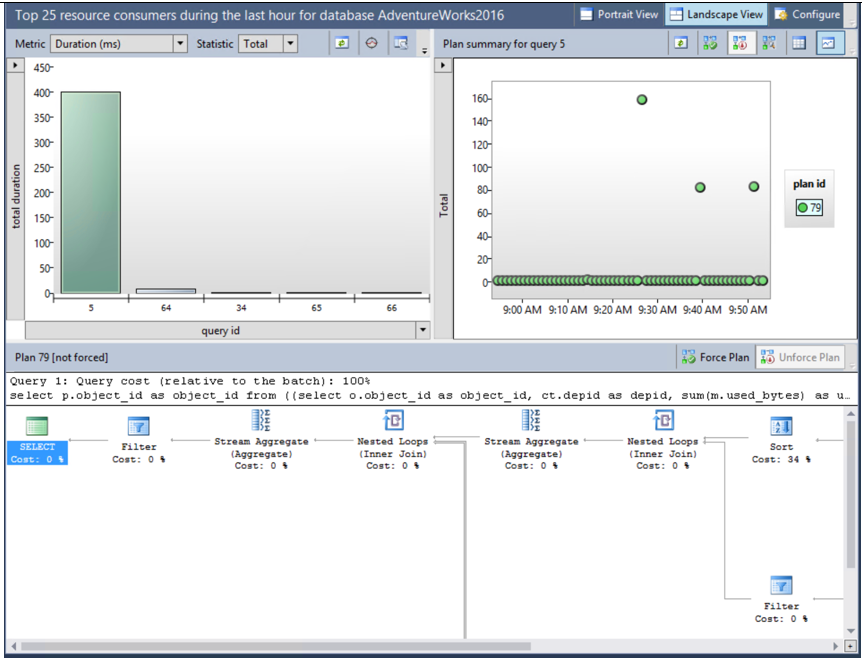
3. Click on “Top Resource Consuming Queries” view. The report displays the Top 25 resource consuming queries.
Sample report looks like below:
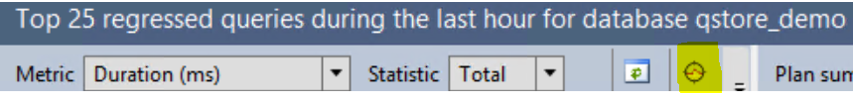
Click on Configure button on Top right corner which helps in selecting the time Interval of interest. For example, if you would want to review the data for the last 5 minutes, select “5 minutes” in the drop-down list. By default, its set to Last Hour.
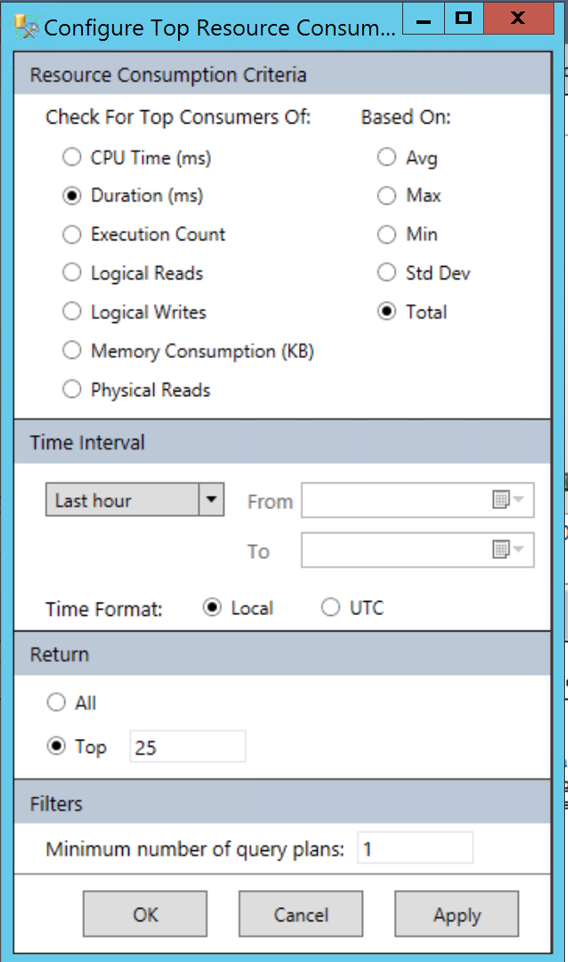
Click on Apply.
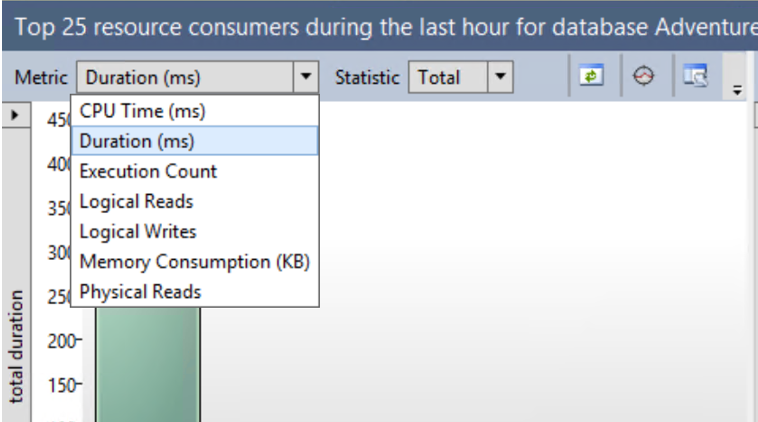
4. In the Metric Field, select “Duration(ms)”, to review the Long running queries in the Time interval specified in last step.
Select “CPU Time (ms)”, to review the TOP CPU consuming queries in the Time interval specified in the last step.
Select “Memory Consumption (KB)”, to review the TOP memory consuming queries.
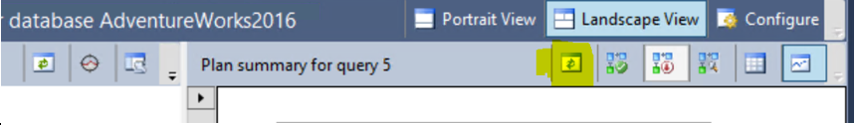
5. The report can be refreshed manually:
6. To review the queries individually, click on the Histogram bar, which displays the Plan summary and the estimated execution Plan of the query.
Also, if you hover over the histogram bar, query store displays the Query ID, duration, number of executions and the Number of plans.
7. To copy the query text, click on query to text option, which copies the query text to a new query editor Window.

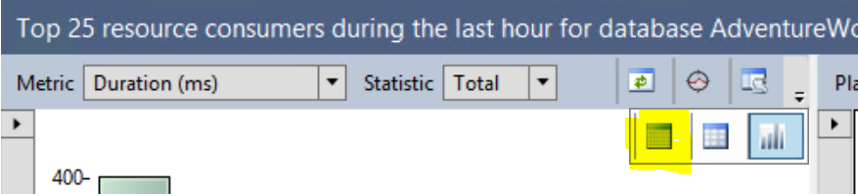
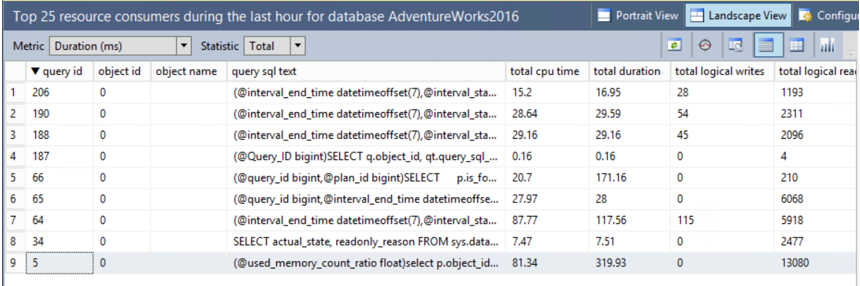
8. To View the queries in grid format, select “View Top Resource Consuming Queries in grid format with additional details”
Which displays the number of queries in grid format: Note that the report includes the Total Duration, Total CPU time, total logical reads, Total memory consumption(KB) and other resource metrics. The data can be sorted in descending order as needed. Also, the column positions can be moved as per the requirement.
9. “Overall Resource Consumption” view can be used to review the overall resource consumption. Select “Configure” button to choose the time interval of interest to display the report only for selected interval.
The sample report looks like below:
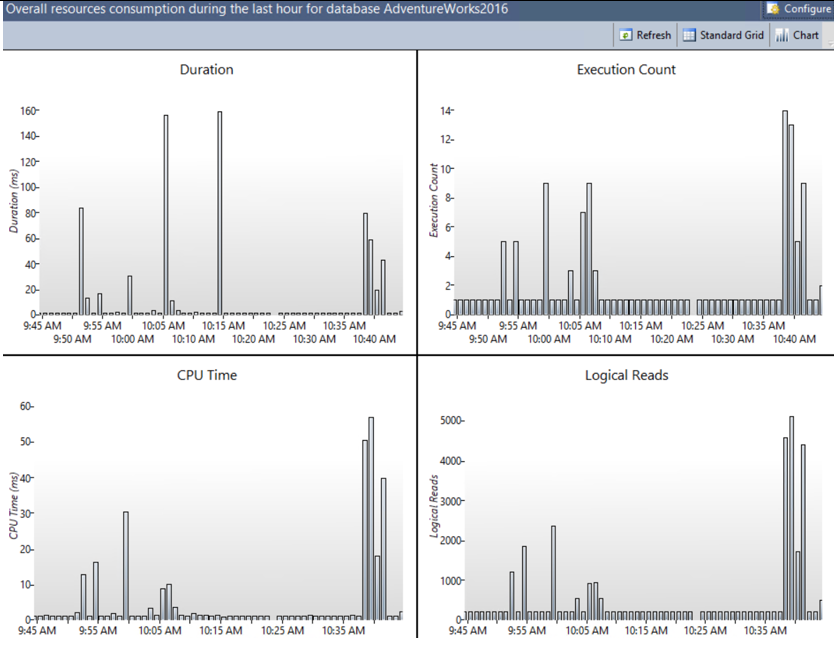
Now, this report can be drilled further. For example, to review the high CPU consuming queries, click on the bar with high CPU time in CPU Time section to review the queries individually, which points to the “Top 25 resource consuming queries” view with CPU Time as the metric.
10. If the user reports intermittent application slowness for specific queries, then “Regressed Queries” query store view need to be explored.
For example: If user reports a scenario of stored procedure execution slowness intermittently, and we want to review the execution plans of the good and bad run, regression queries is the right choice.
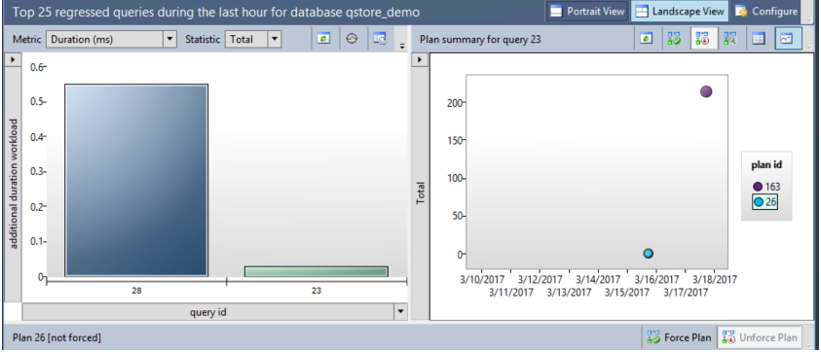
Double click on “Regressed Queries” view. Sample report is as below
The query ID for the query which need to be investigated can be identified with hovering over the all the queries or by selecting “viewing the regressed query in Grid format”.
Once the query ID is identified, click on the query which need to be reviewed:
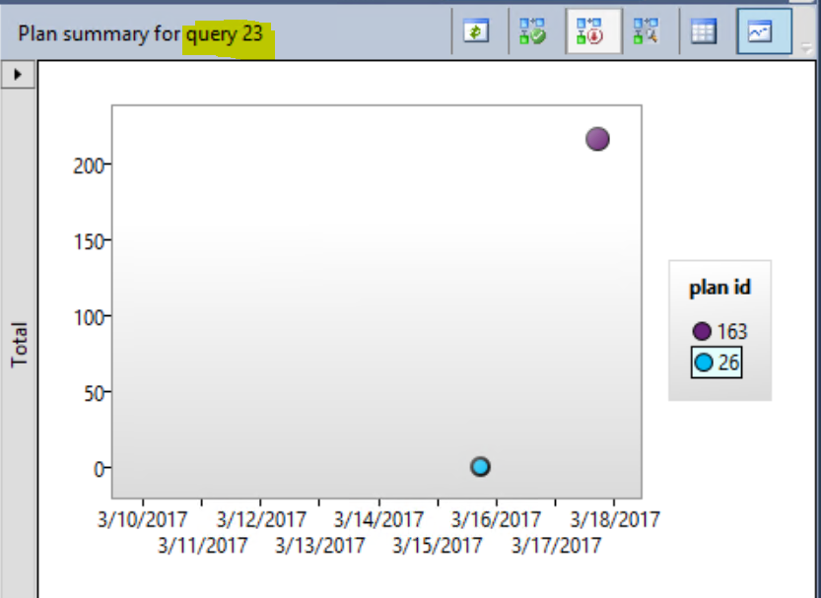
Plan summary section displays all the different execution plan compiled for the query for the given time interval specified.
For example:
As per the below summary, the query ID identified is 23 and the query is compiled with 2 different execution plans over course of time.
Plan ID 26 has the Avg duration of 1.59 and Plan 163 has the Avg duration of 31, which indicates that the execution of the query with Plan ID 163 is expensive.
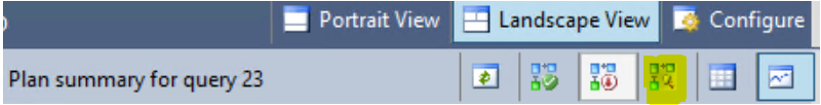
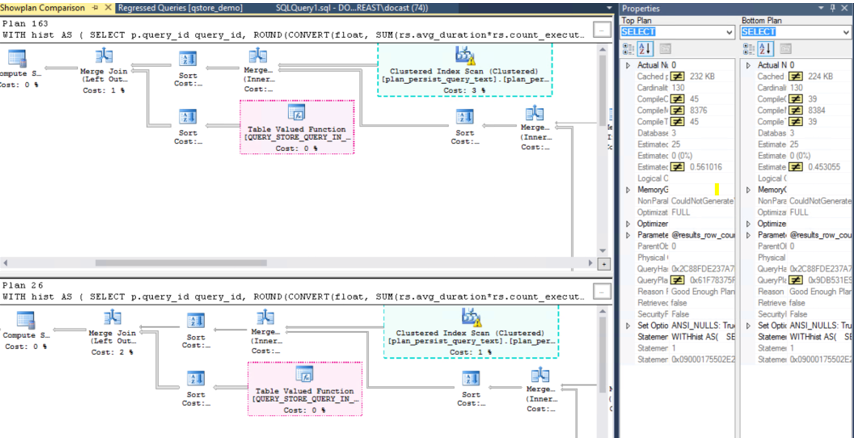
11. The different execution plans for the same query can be compared using “Compare plan option”
For example,
Comparing the plan for the query mentioned in step 10 gives the report as below which helps in further investigation.
12. To fix the regression query issue, query with the good execution plan can be forced using “Force Plan” option.
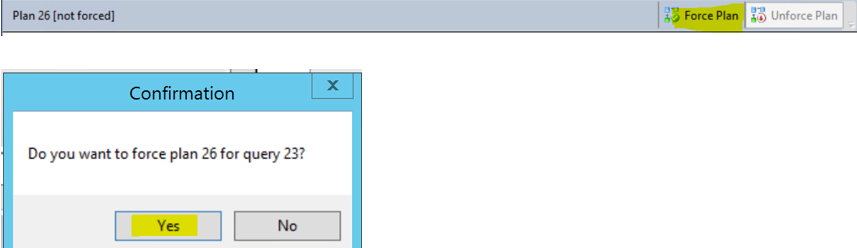
To check if the plan is forced or not,
- Hover over the Plan ID in Plan summary which indicates “Plan forced: Yes”
- The execution Plan shows forced as below:

Similarly, the forced plan can be unforced using “Unforce Plan” option
13. To track the execution of one specific query, “Tracked Query” view can be used which tracks the execution statistics of the selected query and the report can be refreshed using refresh option. This is helpful in monitoring the queries which are using Forced Plan.
14. The report which is available in GUI can also be obtained via T SQL queries.
--Plans per query
SELECT qt.query_sql_text, q.query_id, qt.query_text_id, p.plan_id,
rs.runtime_stats_id, rsi.start_time, rsi.end_time, rs.avg_physical_io_reads,
rs.avg_rowcount, rs.count_executions, rs.execution_type_desc, p.query_plan, so.name, so.type
FROM
sys.query_store_query_text qt JOIN
sys.query_store_query q ON qt.query_text_id = q.query_text_id JOIN
sys.query_store_plan p ON q.query_id = p.query_id JOIN
sys.query_store_runtime_stats rs ON p.plan_id = rs.plan_id JOIN
sys.query_store_runtime_stats_interval rsi ON rsi.runtime_stats_interval_id = rs.runtime_stats_interval_id JOIN
sysobjects so on so.id = q.object_id
--where rs.execution_type=4
order by count_executions desc
--Top queries based on Total executions
SELECT qt.query_sql_text, q.query_id, so.name, so.type,sum(rs.count_executions) as 'Total_Executions'
FROM
sys.query_store_query_text qt JOIN
sys.query_store_query q ON qt.query_text_id = q.query_text_id JOIN
sys.query_store_plan p ON q.query_id = p.query_id JOIN
sys.query_store_runtime_stats rs ON p.plan_id = rs.plan_id JOIN
sys.query_store_runtime_stats_interval rsi ON rsi.runtime_stats_interval_id = rs.runtime_stats_interval_id JOIN
sysobjects so on so.id = q.object_id
WHERE rsi.start_time >= DATEADD(DAY, -10, GETUTCDATE())
group by qt.query_sql_text, q.query_id, so.name, so.type
order by sum(rs.count_executions) desc
--Top queries based on Avg. CPU Time
SELECT qt.query_sql_text, q.query_id, so.name, so.type,avg(rs.avg_cpu_time) as 'Avg. CPU Time'
FROM
sys.query_store_query_text qt JOIN
sys.query_store_query q ON qt.query_text_id = q.query_text_id JOIN
sys.query_store_plan p ON q.query_id = p.query_id JOIN
sys.query_store_runtime_stats rs ON p.plan_id = rs.plan_id JOIN
sys.query_store_runtime_stats_interval rsi ON rsi.runtime_stats_interval_id = rs.runtime_stats_interval_id JOIN
sysobjects so on so.id = q.object_id
WHERE rsi.start_time >= DATEADD(DAY, -10, GETUTCDATE())
group by qt.query_sql_text, q.query_id, so.name, so.type
order by avg(rs.avg_cpu_time) desc
--Per Query Detail (Top queries based on Avg. CPU Time)
SELECT qt.query_sql_text, q.query_id, so.name, so.type,rs.avg_cpu_time
FROM
sys.query_store_query_text qt JOIN
sys.query_store_query q ON qt.query_text_id = q.query_text_id JOIN
sys.query_store_plan p ON q.query_id = p.query_id JOIN
sys.query_store_runtime_stats rs ON p.plan_id = rs.plan_id JOIN
sys.query_store_runtime_stats_interval rsi ON rsi.runtime_stats_interval_id = rs.runtime_stats_interval_id JOIN
sysobjects so on so.id = q.object_id
WHERE rsi.start_time >= DATEADD(DAY, -10, GETUTCDATE())
order by rs.avg_cpu_time desc
--Top queries based on Avg. Duration
SELECT qt.query_sql_text, q.query_id, so.name, so.type,avg(rs.avg_duration) as 'Avg. Duration'
FROM
sys.query_store_query_text qt JOIN
sys.query_store_query q ON qt.query_text_id = q.query_text_id JOIN
sys.query_store_plan p ON q.query_id = p.query_id JOIN
sys.query_store_runtime_stats rs ON p.plan_id = rs.plan_id JOIN
sys.query_store_runtime_stats_interval rsi ON rsi.runtime_stats_interval_id = rs.runtime_stats_interval_id JOIN
sysobjects so on so.id = q.object_id
WHERE rsi.start_time >= DATEADD(DAY, -10, GETUTCDATE())
group by qt.query_sql_text, q.query_id, so.name, so.type
order by avg(rs.avg_duration) desc
--Per Query Detail (Top queries based on Avg. Duration)
SELECT qt.query_sql_text, q.query_id, so.name, so.type,rs.avg_duration
FROM
sys.query_store_query_text qt JOIN
sys.query_store_query q ON qt.query_text_id = q.query_text_id JOIN
sys.query_store_plan p ON q.query_id = p.query_id JOIN
sys.query_store_runtime_stats rs ON p.plan_id = rs.plan_id JOIN
sys.query_store_runtime_stats_interval rsi ON rsi.runtime_stats_interval_id = rs.runtime_stats_interval_id JOIN
sysobjects so on so.id = q.object_id
WHERE rsi.start_time >= DATEADD(DAY, -10, GETUTCDATE())
order by rs.avg_duration desc
--Top queries based on Avg. Logical IO Reads
SELECT qt.query_sql_text, q.query_id, so.name, so.type,avg(rs.avg_logical_io_reads) as 'Avg. Logical IO Reads'
FROM
sys.query_store_query_text qt JOIN
sys.query_store_query q ON qt.query_text_id = q.query_text_id JOIN
sys.query_store_plan p ON q.query_id = p.query_id JOIN
sys.query_store_runtime_stats rs ON p.plan_id = rs.plan_id JOIN
sys.query_store_runtime_stats_interval rsi ON rsi.runtime_stats_interval_id = rs.runtime_stats_interval_id JOIN
sysobjects so on so.id = q.object_id
WHERE rsi.start_time >= DATEADD(DAY, -10, GETUTCDATE())
group by qt.query_sql_text, q.query_id, so.name, so.type
order by avg(rs.avg_logical_io_reads) desc
--Per Query Detail (Top queries based on Avg. Logical IO Reads)
SELECT qt.query_sql_text, q.query_id, so.name, so.type,rs.avg_logical_io_reads
FROM
sys.query_store_query_text qt JOIN
sys.query_store_query q ON qt.query_text_id = q.query_text_id JOIN
sys.query_store_plan p ON q.query_id = p.query_id JOIN
sys.query_store_runtime_stats rs ON p.plan_id = rs.plan_id JOIN
sys.query_store_runtime_stats_interval rsi ON rsi.runtime_stats_interval_id = rs.runtime_stats_interval_id JOIN
sysobjects so on so.id = q.object_id
WHERE rsi.start_time >= DATEADD(DAY, -10, GETUTCDATE())
order by rs.avg_logical_io_reads desc
--Top queries based on Avg. Logical IO Writes
SELECT qt.query_sql_text, q.query_id, so.name, so.type,avg(rs.avg_logical_io_writes) as 'Avg. Logical IO Writes'
FROM
sys.query_store_query_text qt JOIN
sys.query_store_query q ON qt.query_text_id = q.query_text_id JOIN
sys.query_store_plan p ON q.query_id = p.query_id JOIN
sys.query_store_runtime_stats rs ON p.plan_id = rs.plan_id JOIN
sys.query_store_runtime_stats_interval rsi ON rsi.runtime_stats_interval_id = rs.runtime_stats_interval_id JOIN
sysobjects so on so.id = q.object_id
WHERE rsi.start_time >= DATEADD(DAY, -10, GETUTCDATE())
group by qt.query_sql_text, q.query_id, so.name, so.type
order by avg(rs.avg_logical_io_writes) desc
--Per Query Detail (Top queries based on Avg. Logical IO Writes)
SELECT qt.query_sql_text, q.query_id, so.name, so.type,rs.avg_logical_io_writes
FROM
sys.query_store_query_text qt JOIN
sys.query_store_query q ON qt.query_text_id = q.query_text_id JOIN
sys.query_store_plan p ON q.query_id = p.query_id JOIN
sys.query_store_runtime_stats rs ON p.plan_id = rs.plan_id JOIN
sys.query_store_runtime_stats_interval rsi ON rsi.runtime_stats_interval_id = rs.runtime_stats_interval_id JOIN
sysobjects so on so.id = q.object_id
WHERE rsi.start_time >= DATEADD(DAY, -10, GETUTCDATE())
order by rs.avg_logical_io_writes desc
--Exception Queries
SELECT qt.query_sql_text, q.query_id, qt.query_text_id, p.plan_id,
rs.runtime_stats_id, rsi.start_time, rsi.end_time, rs.avg_physical_io_reads,
rs.avg_rowcount, rs.count_executions, rs.execution_type_desc, p.query_plan, so.name, so.type
FROM
sys.query_store_query_text qt JOIN
sys.query_store_query q ON qt.query_text_id = q.query_text_id JOIN
sys.query_store_plan p ON q.query_id = p.query_id JOIN
sys.query_store_runtime_stats rs ON p.plan_id = rs.plan_id JOIN
sys.query_store_runtime_stats_interval rsi ON rsi.runtime_stats_interval_id = rs.runtime_stats_interval_id JOIN
sys.objects so on so.object_id = q.object_id
where rs.execution_type=4
order by count_executions desc
--Aborted Queries
SELECT qt.query_sql_text, q.query_id, qt.query_text_id, p.plan_id,
rs.runtime_stats_id, rsi.start_time, rsi.end_time, rs.avg_physical_io_reads,
rs.avg_rowcount, rs.count_executions, rs.execution_type_desc, p.query_plan, so.name, so.type
FROM
sys.query_store_query_text qt JOIN
sys.query_store_query q ON qt.query_text_id = q.query_text_id JOIN
sys.query_store_plan p ON q.query_id = p.query_id JOIN
sys.query_store_runtime_stats rs ON p.plan_id = rs.plan_id JOIN
sys.query_store_runtime_stats_interval rsi ON rsi.runtime_stats_interval_id = rs.runtime_stats_interval_id JOIN
sys.objects so on so.object_id = q.object_id
where rs.execution_type=3
order by count_executions desc
Hope the above steps mentioned will help you in troubleshooting SQL query Performance issues using SQL Query store.
Happy troubleshooting!
Please share your feedback, questions and/or suggestions.
Thanks,
Don Castelino | Premier Field Engineer | Microsoft
Disclaimer: All posts are provided AS IS with no warranties and confer no rights. Additionally, views expressed here are my own and not those of my employer, Microsoft.