Troubleshooting IIS request performance slowness issues using FREB tracing
Hello all,
In this blog, I would like to cover the scenario of troubleshooting web application page execution slowness issue using Freb logs.
FREB (Failed Requests Tracing) is one of the feature available to troubleshoot IIS issues. It does request based tracing, and produces a log file (in .xml format) that shows events and notifications from the various modules that worked on the request during its lifecycle. Failed-request tracing is designed to buffer the trace events for a request and only flush them to disk when the filter condition is met.
FREB Installation steps:
If FREB feature is not installed on IIS server: To install FREB, In Server manager >> Add Roles and Features wizard >> on the Server Roles page, expand Web Server (IIS), expand Web Server, expand Health and Diagnostics, and then select Tracing.
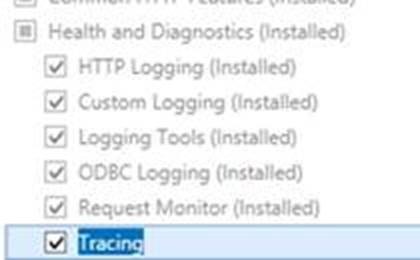
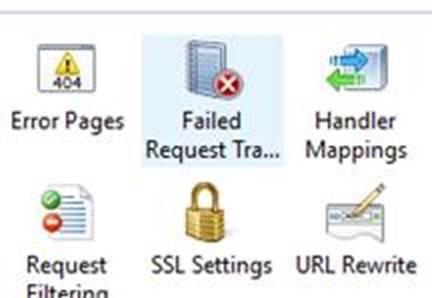
Once the feature is installed, Failed request tracing icon appears in the IIS manager.
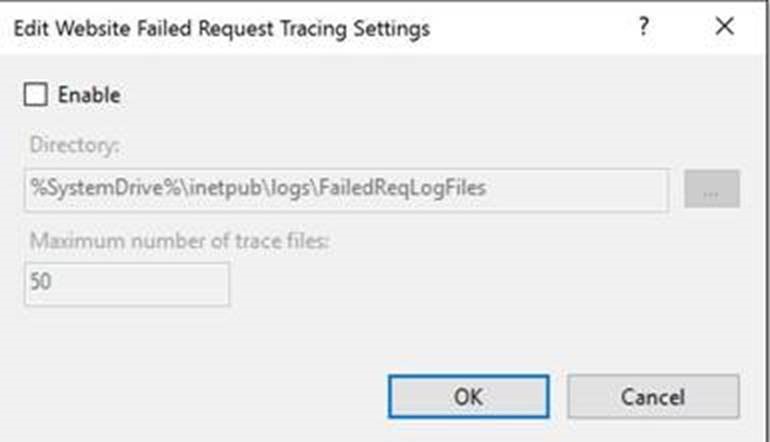
Enable FREB logging using – edit site tracing options.
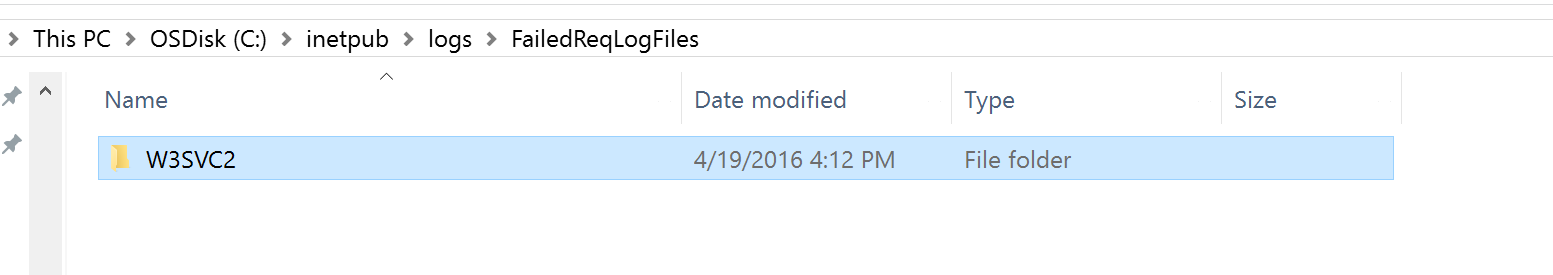
By default, the Freb log files are saved to “%SystemDrive%\inetpub\logs\FailedReqLogFiles” location.
To demonstrate Freb data collection analysis, covering the scenario of : web application taking long time to load.
To simulate the issue, using the setup available from: https://blogs.msdn.microsoft.com/tess/2008/02/04/net-debugging-demos-information-and-setup-instructions/
Scenario: Slow Performance
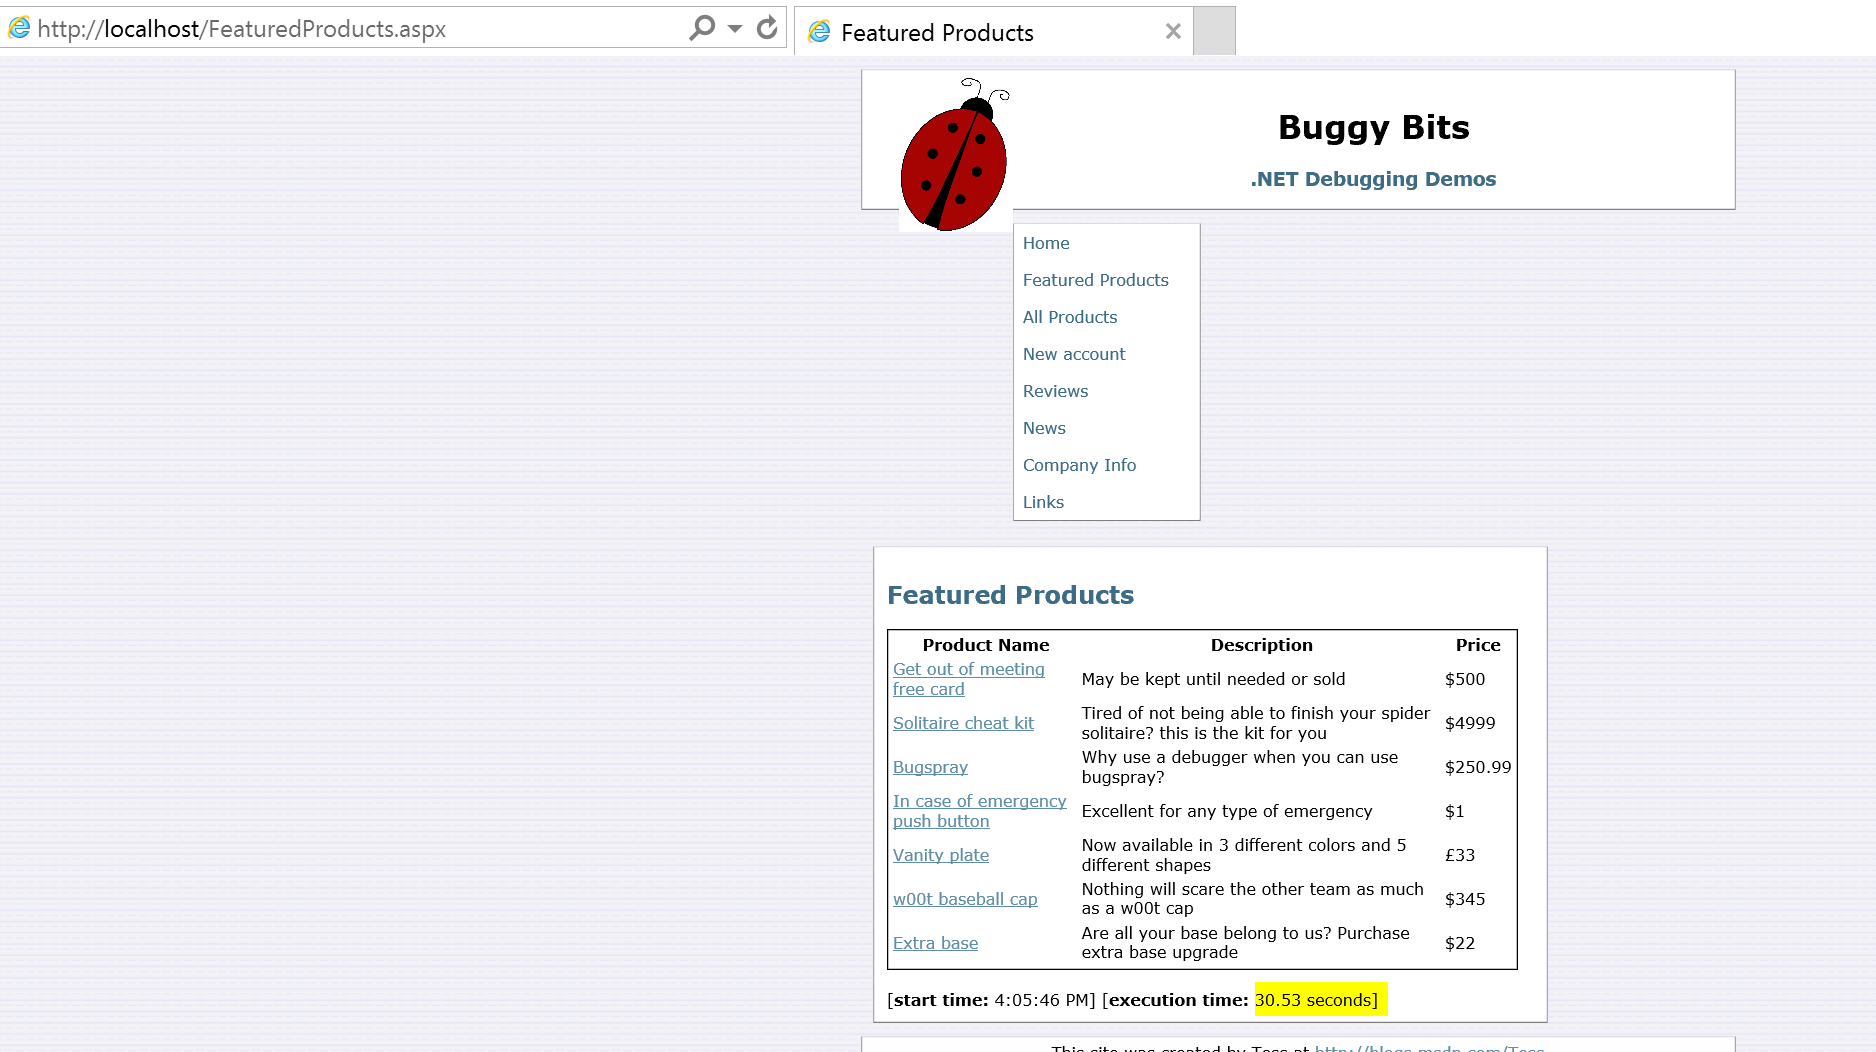
FeaturedProducts.aspx page which ideally takes 5 seconds to load is taking 30 seconds to load.
https://localhost/FeaturedProducts.aspx
For 30 seconds, browser keeps loading:
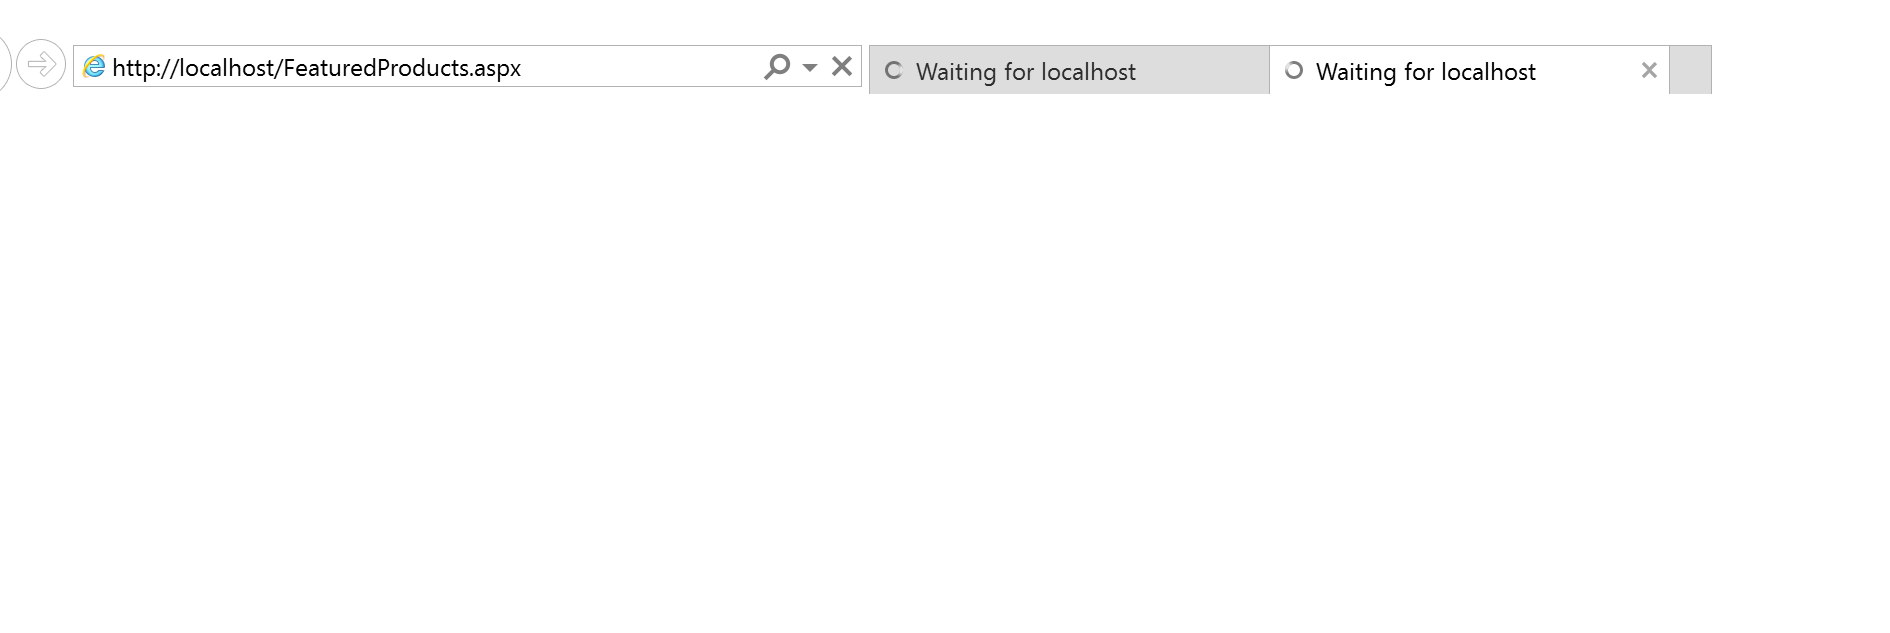
It took 30.53 seconds to load the page.
FREB data collection steps:
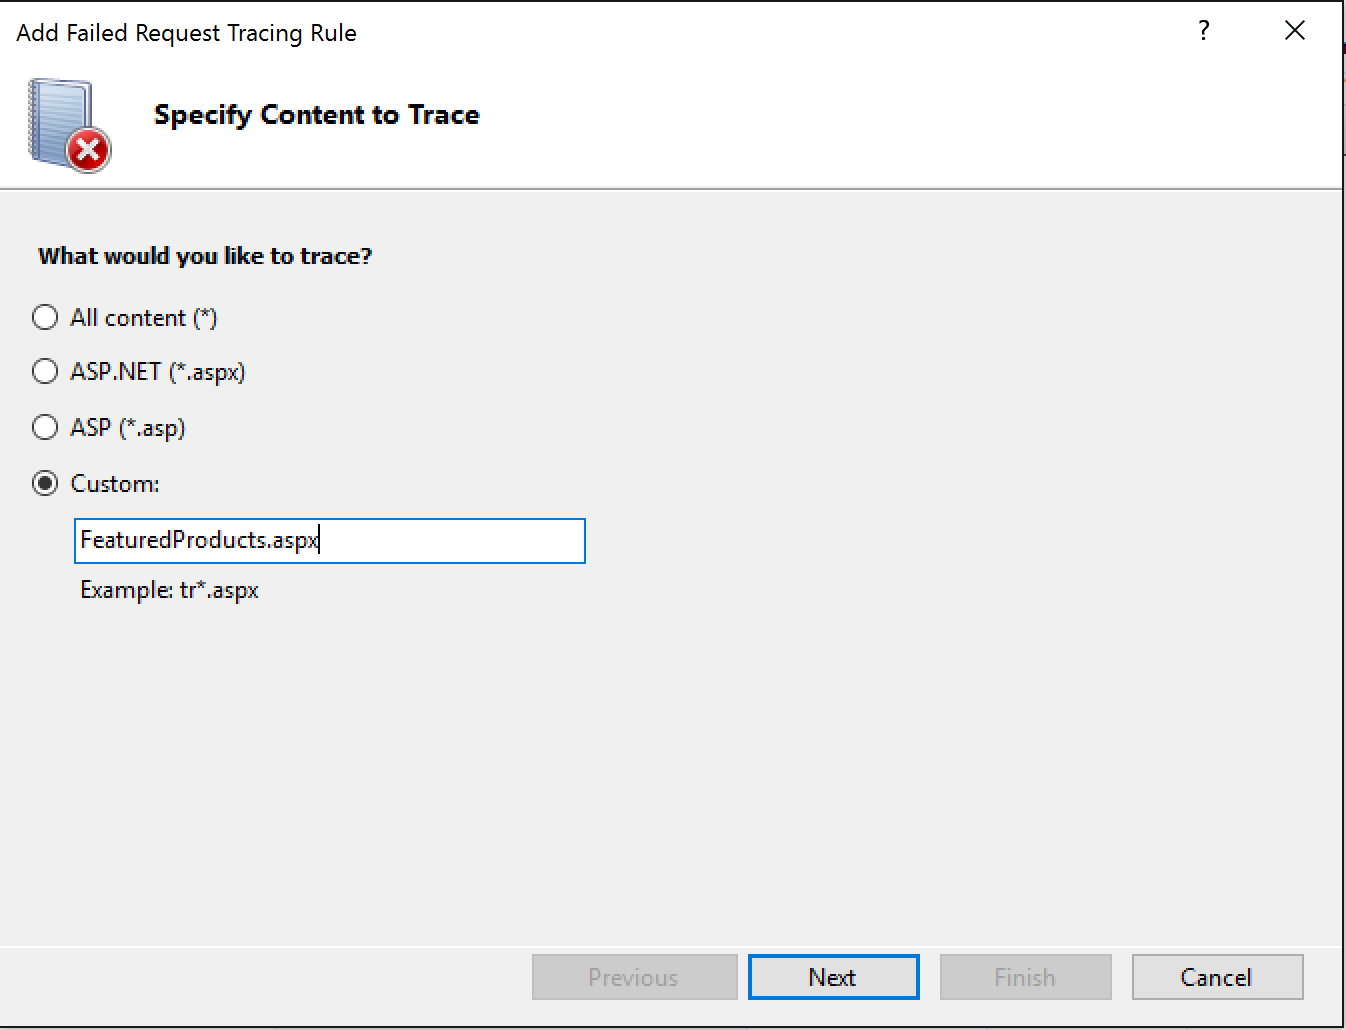
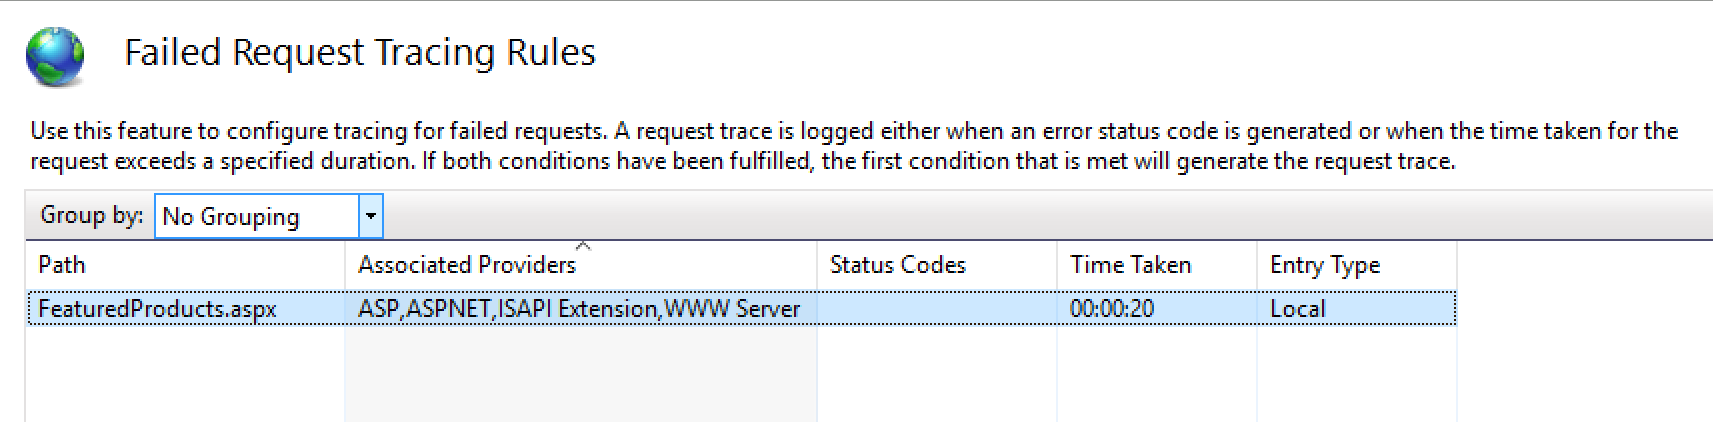
Let's configure Freb tracing to isolate the module which is causing the page slowness issue. In our scenario, the slowness is observed while browsing the page FeaturedProducts.aspx. Setting up Freb tracing only to capture the traces for FeaturedProducts.aspx
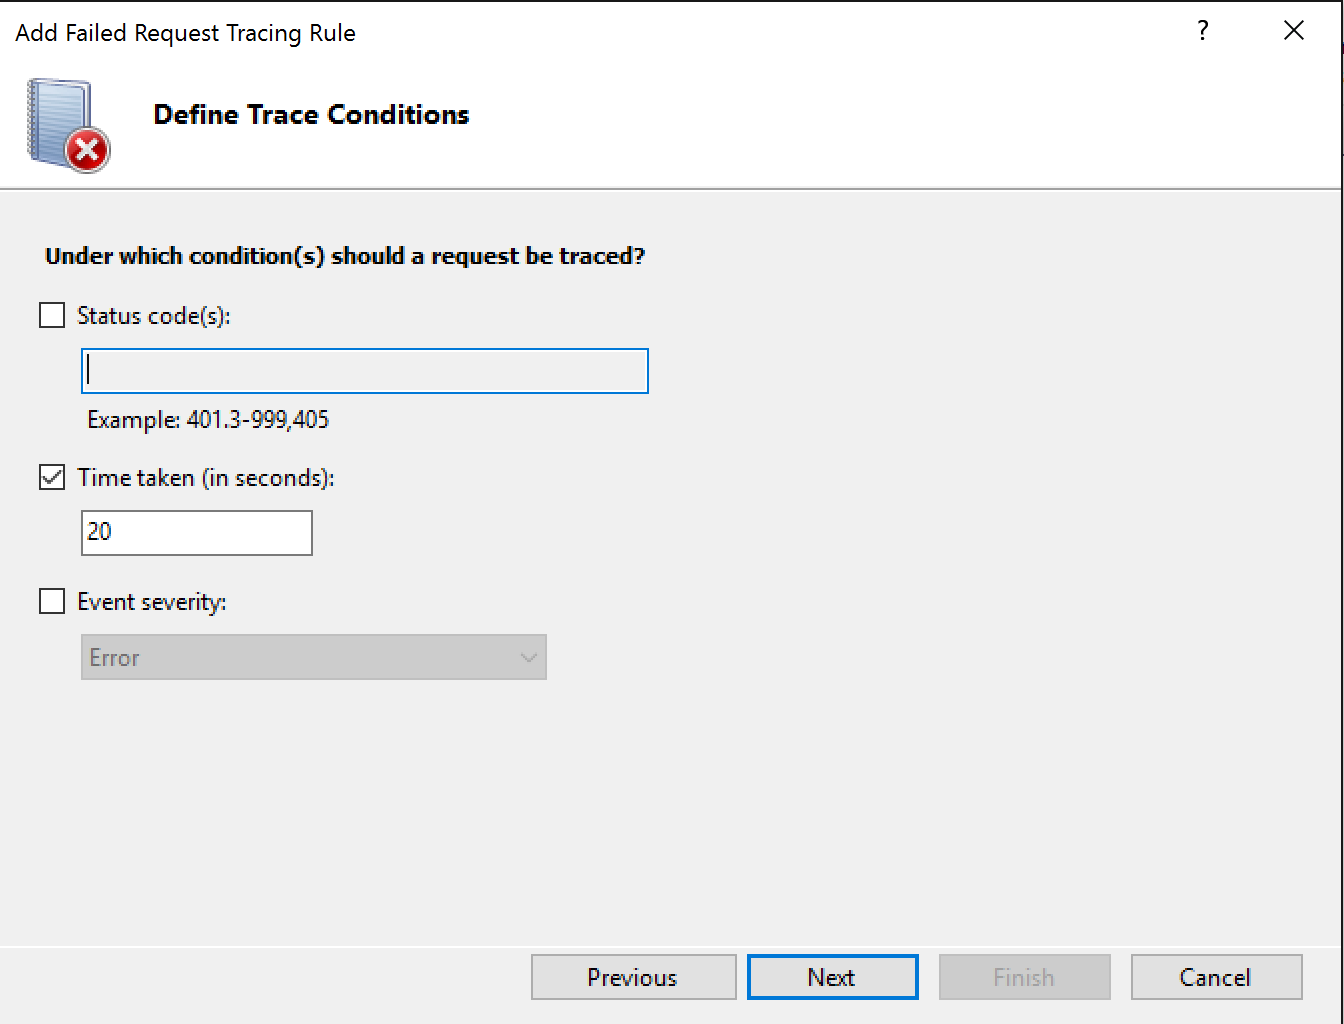
Also, the rule setup for data collection is 20 seconds. Freb logs would be collected only when FeaturedProducts.aspx requests take more than 20 seconds.
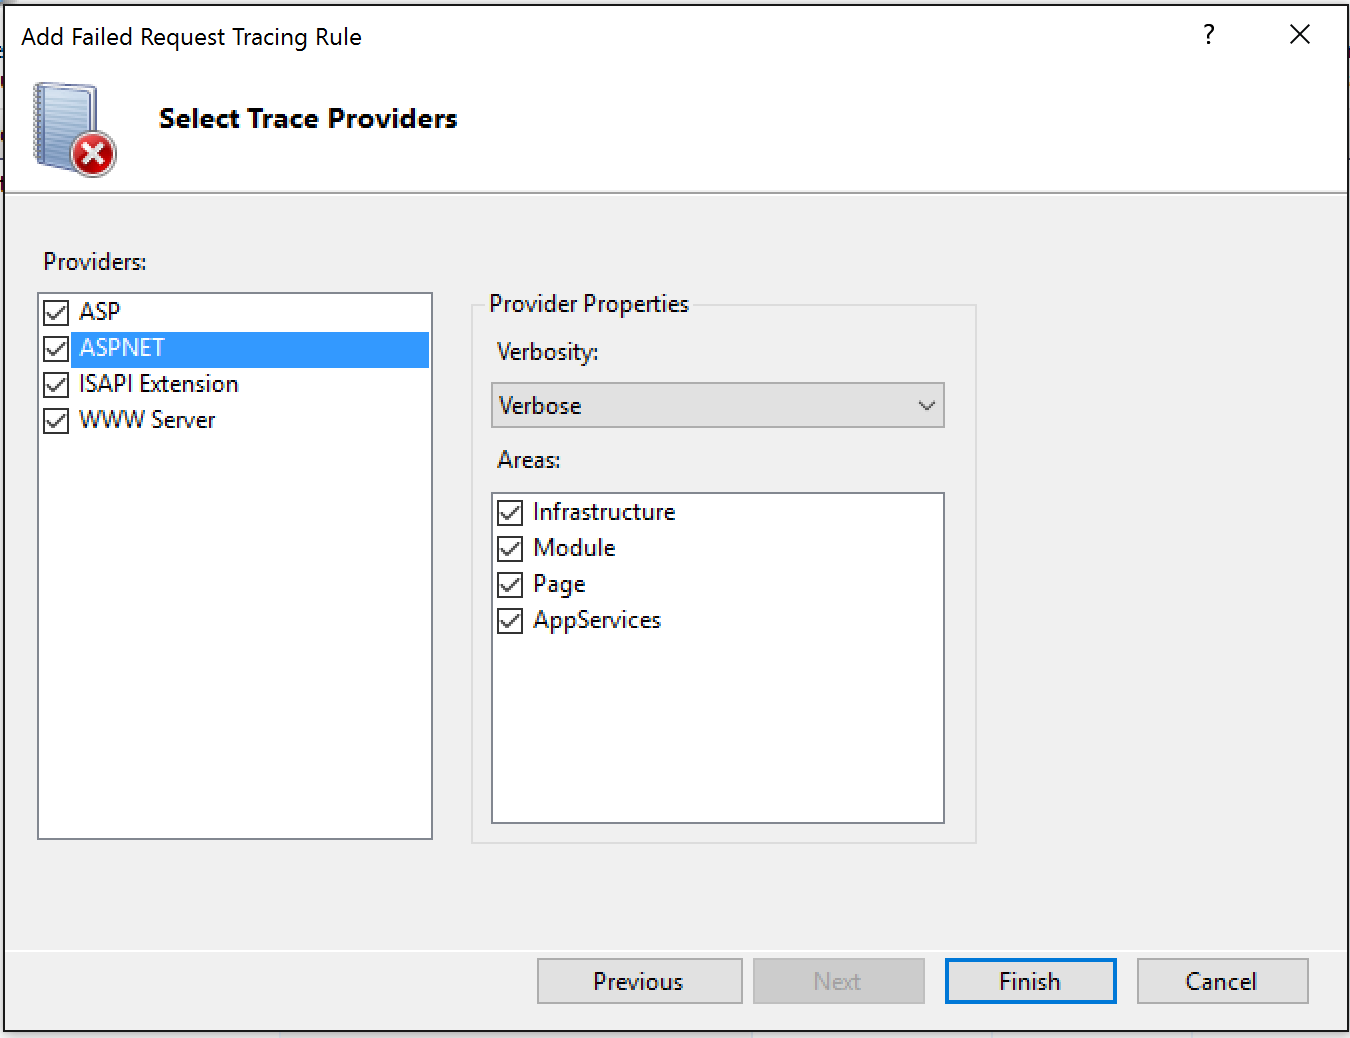
Freb data collection rule is created:
Next step is to reproduce the issue.
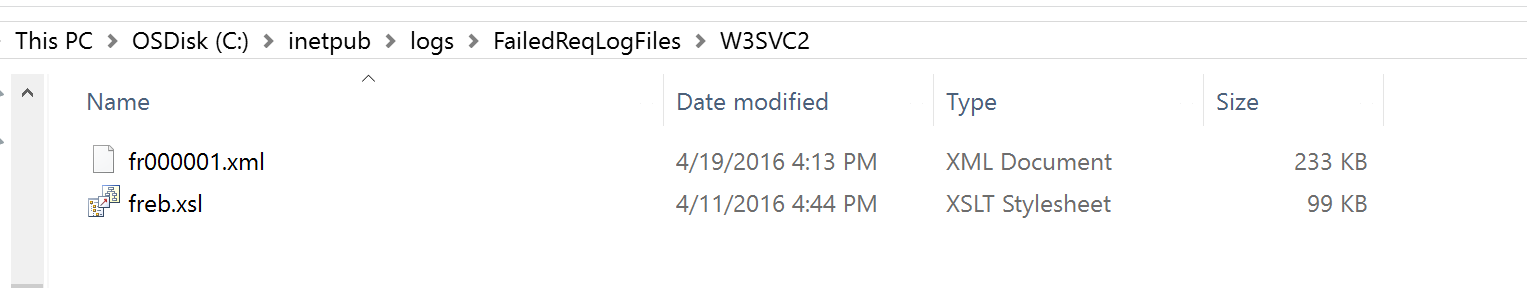
The logs are located at:
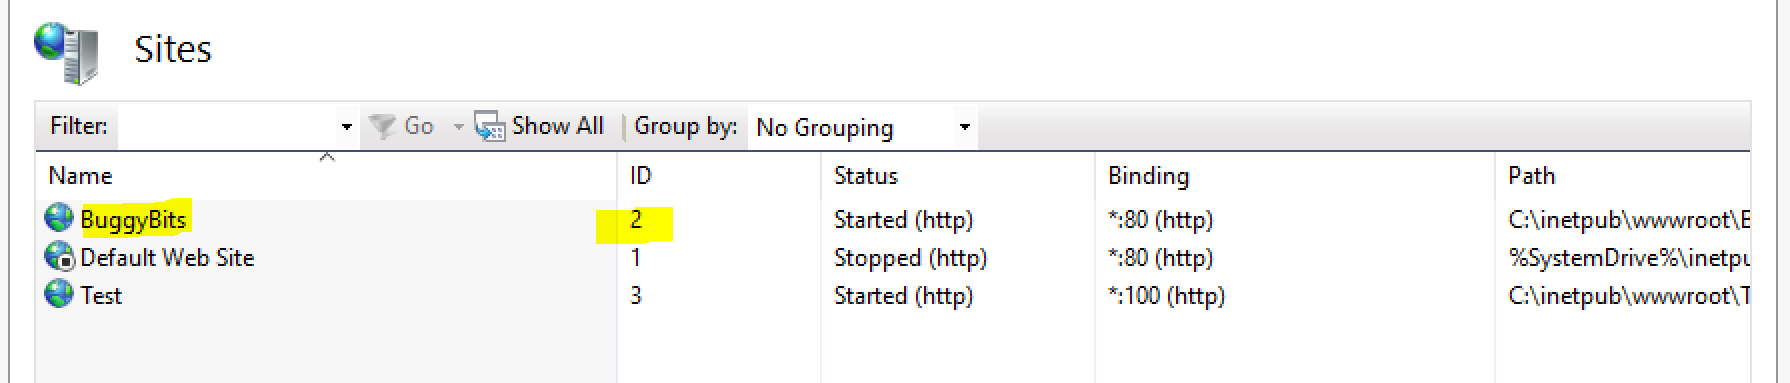
To confirm that the data collected is for the site which is of interest, cross verifying the site ID.
FREB Analysis:
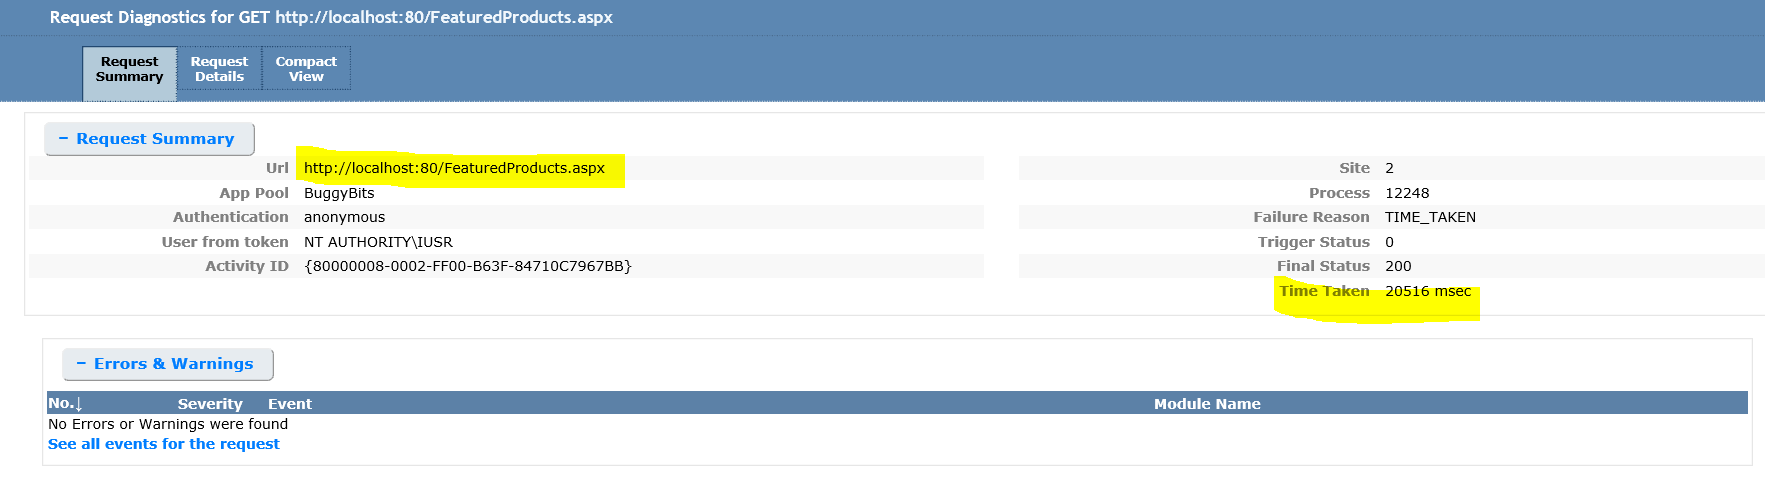
Opening the xml file created, gives the below information:
Clicking on compact view:
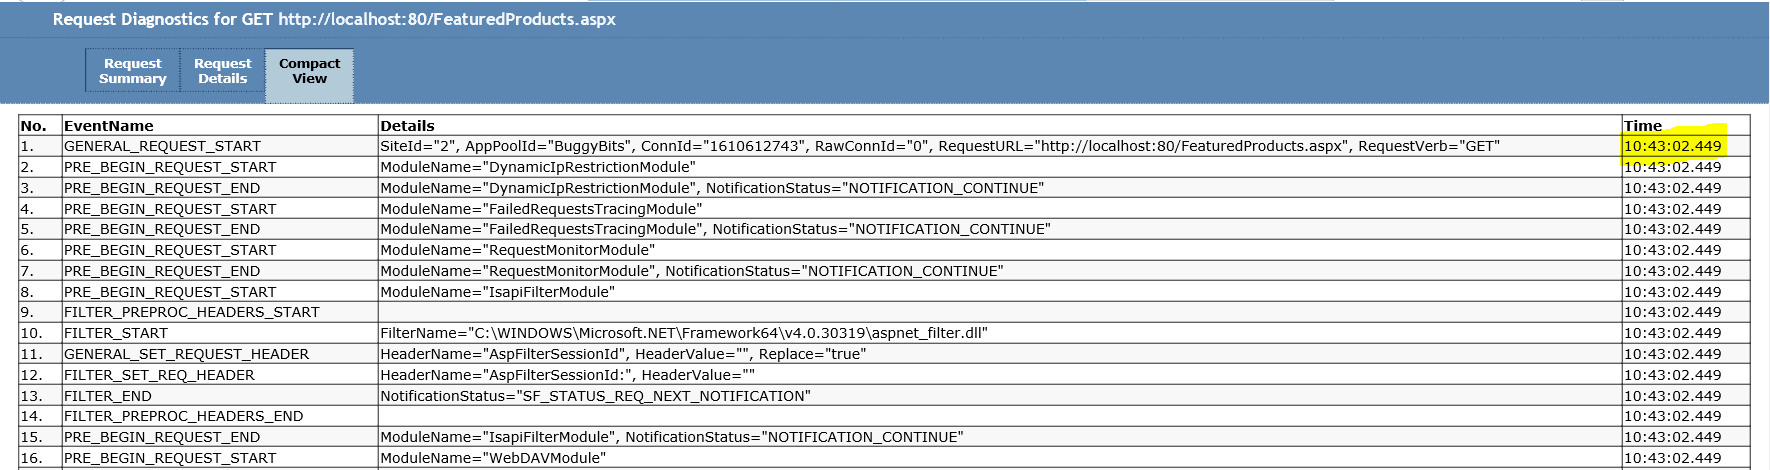
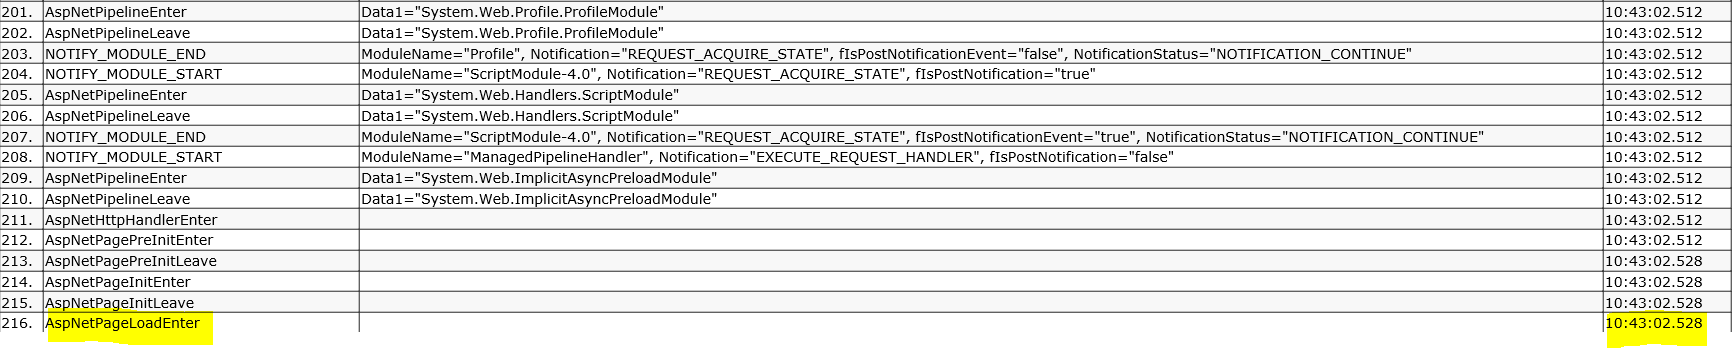
From the Freb output: The request reached IIS and the request execution started at 10:43.02.449 and at the end of the data collection, the last event which got executed is ASPNETPageLoadEnter at 10:43.02.528. This clearly indicates that the time is taken while executing the AspNet code.
Freb logs collected clearly indicates that the page execution is taking time in executing the ASP.Net code. Freb logs comes in very handy while troubleshooting IIS issues to isolate the module which is taking time to execute. In our scenario, it’s the ASP.Net execution module.
Next step would be to collect the dumps of the IIS worker process to get the callstack of the thread which is executing the ASPX request.
Take the dumps of the IIS process every 10 seconds interval and analyzing it using debugdiag analysis:
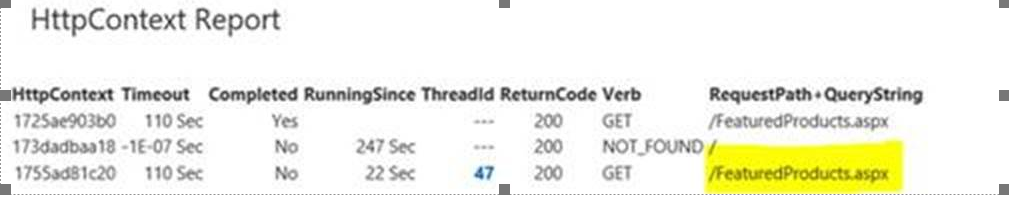
From the above httpcontext report, thread ID 47 is executing FeaturedProducts.aspx request and it has been executing for 22 seconds.
To get the call stack of the thread, we can analyze the dumps using Windbg tool as well. The call stack can be obtained from the Debugdiag analysis tool too.
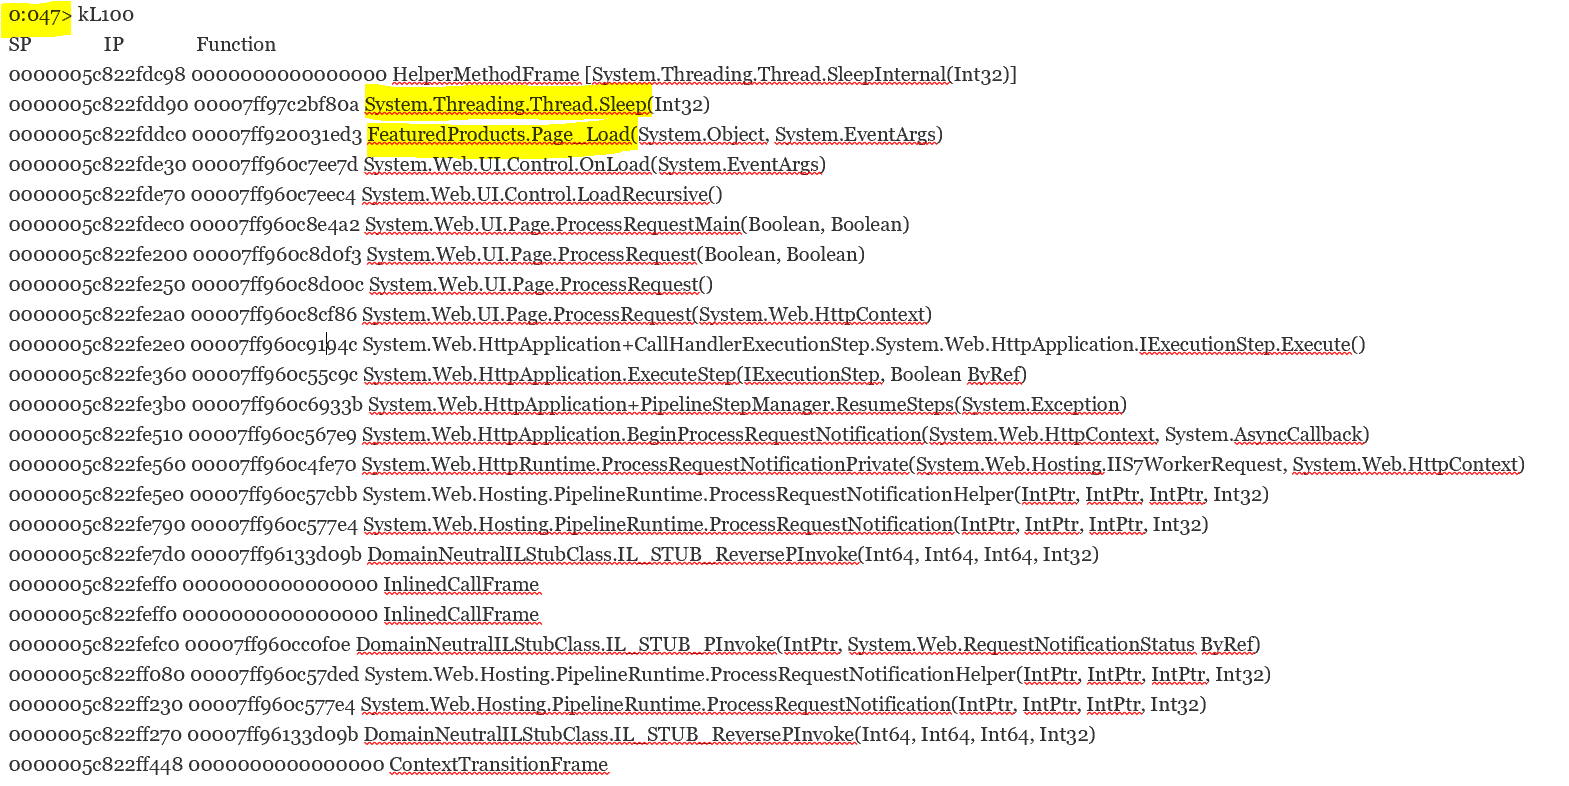
Aligning the code which called the method Page_Load:
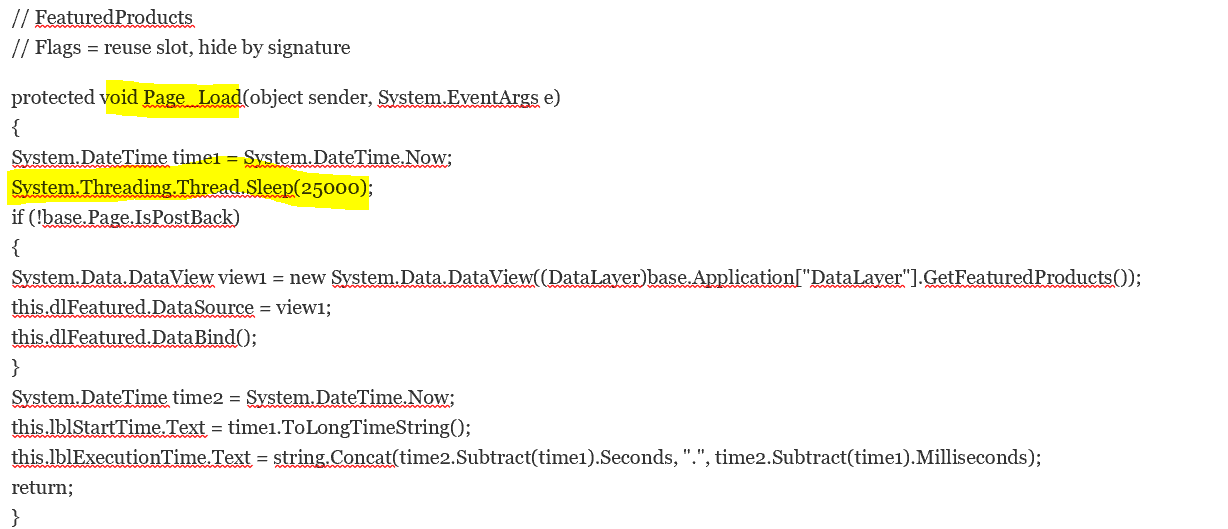
In our scenario, I have explicitly called Thread.sleep() method to suspend the current thread for 25 seconds which will induce the slowness.
To summarize, FREB tracing helps in isolating Problems like poor performance on some requests, or authentication-related failures on other requests, or the server 500 error from ASP or ASP.NET can often be difficult to troubleshoot--
Once we isolate the module causing the slowness, then further action can be taken to either collect additional data like worker process dump collection or fix the module which is causing the issue.
Please share your feedback, questions and/or suggestions.
Thanks,
Don Castelino | Premier Filed Engineer | Microsoft
Disclaimer: All posts are provided AS IS with no warranties and confer no rights. Additionally, views expressed here are my own and not those of my employer, Microsoft.