Performance Monitor user-defined data collector set doesn’t collect 32-bit SQL data when installed on a 64-bit OS
Hello All,
Recently, I worked on an interesting issue with SQL data collection for user-defined data collection set. And I would like to share my thoughts on the workaround available to address this issue.
Problem description
When a 32-bit SQL Server is installed on a 64-bit Windows Operating System, Performance Monitor user-defined data collection set does not capture SQL Counter data.
Steps to reproduce the issue
The good news is that the issue is reproducible. To demonstrate the scenario, I installed a 32-bit SQL 2008 named instance (PerfmonTest) on a 64-bit Windows 2008 R2 Server.
Note: Please note that when Performance Monitor (perfmon) is launched, it invokes perfmon.exe from “C:\Windows\System32” folder. (You can use Process Monitor tool to show the real time process activity.)
If perfmon.exe is launched from the above location, it does not list the SQL Server Counters.
The work around available for this is to:
- Start perfmon.exe from C:\Windows\SysWow64 folder
- On command prompt, run the command: mmc /32 perfmon.msc
Using the above workaround, I was able to see the SQL Counters like in the figure below.
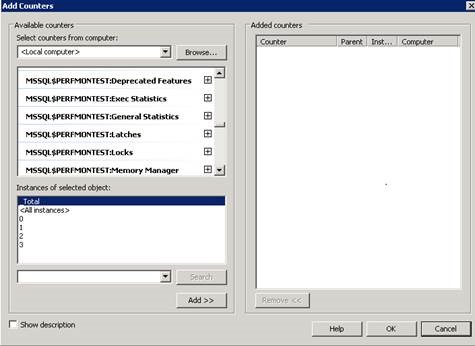
Figure 1: SQL Counters
I created user defined data collection set named “Memory” to capture the SQL memory utilization using the below Counters:
Memory: Available MBytes
MSSQL$PerfmonTest: Memory Manager
Target Server Memory (KB)
Total Server Memory (KB)
I collected the data for some time, and while going through the data collected, I noticed that only Available Mbytes information was collected. The Total and Target Server Memory information was not collected by the Data Collector. The issue seemed to be happening only when the data was collected using Data Collector set. Now, user-defined Data Collection launches the “Rundll32.exe” process and then hosts pla.dll inside its address space. Pla.dll is used to capture Performance Logs & Alerts. I was able to get this information from the Task Manager and the Process Monitor tool.
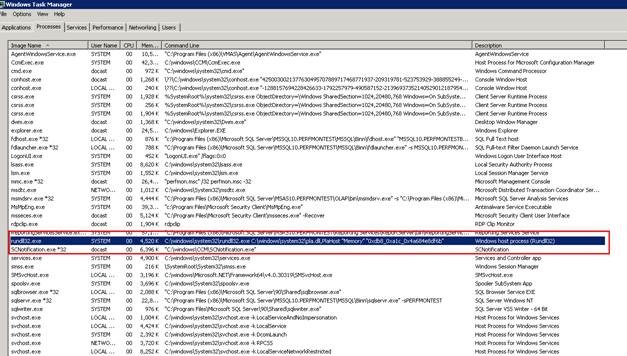
Figure 2: Windows Task Manager
Command line arguments passed were:
C:\windows\system32\rundll32.exe C:\windows\system32\pla.dll,PlaHost "Memory" "0xdb8_0xa1c_0x4a684e8df6b"
The root cause for the above issue was that Rundll32.exe was hosting pla.dll from “C:\windows\system32” folder which should have been “C:\Windows\sysWOW64” in our case. So essentially, the command line should have been:
C:\windows\sysWOW64\rundll32.exe C:\windows\sysWOW64\pla.dll,PlaHost "Memory" "0xdb8_0xa1c_0x4a684e8df6b"
The Hex code was changing every time the data was collected, so I could not hard code this value.
Resolution
Data Collection internally creates a Task Scheduler job, and properties of the job can be retrieved from:
Task Scheduler -> Microsoft -> Windows -> Properties of PLA -> Actions tab -> Edit Action Item
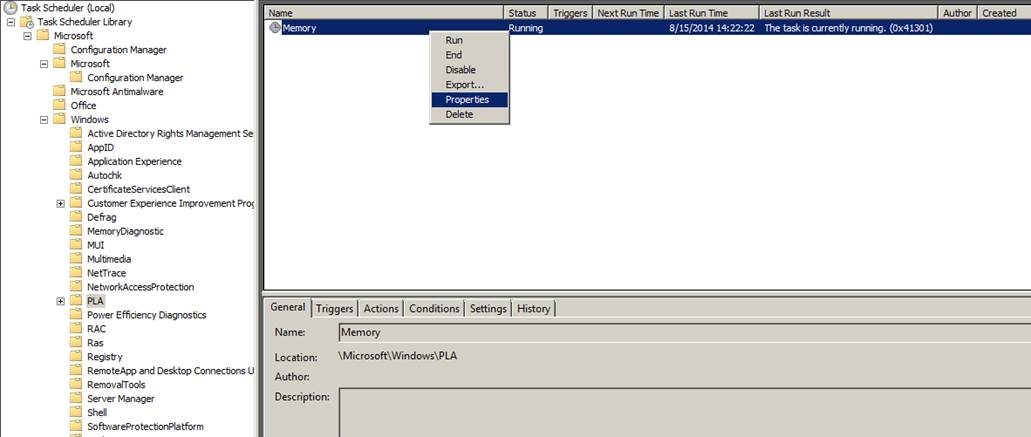
Figure 3: Task Scheduler
The Action Item pointed to the System32 folder:
Program/script: C:\Windows\system32\rundll32.exe
Add Arguments: C:\Windows\system32\pla.dll,PlaHost "Memory" "$(Arg0)"
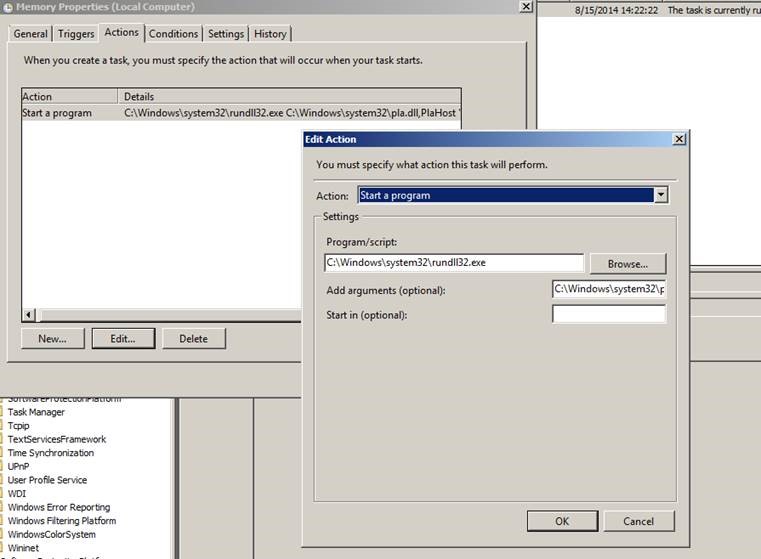
Figure 4: Edit Action window
I changed the above program path to point to “SysWow64” folder and edited the argument passed for pla.dll to point to the “C:\Windows\sysWOW64” folder.
Program/script: C:\Windows\sysWow64\rundll32.exe
Add Arguments: C:\Windows\sysWow64\pla.dll,PlaHost "Memory" "$(Arg0)"
Voila, the user-defined Data Collection for SQL Counters worked fine after making the above changes!
I hope you save a lot of time by using the above resolution.
Please share your feedback, questions and/or suggestions below.
Thanks,
Don Castelino | SQL Server Support Team | CSS - Microsoft
Disclaimer: All posts are provided AS IS with no warranties, and confer no rights. Additionally, views expressed here are my own and not those of my employer, Microsoft.