Using Wire Data in Operations Management Suite Log Search
A little while ago we enabled in the OMS Portal the first iteration of a ‘Wire Data’ solution – check it out in the Solutions Gallery if you haven’t. We didn’t make it in time to formally announce it on the ‘momteam’ blog, but Stas has given us coverage anyways. So here’s a slightly more technical post with some insights into how to query this data and how to tweak the solution.
What do we mean by Wire Data?
The solution uses a custom module for both SCOM and Direct Agent, to hook into the Windows Network Stack and poll statistics from it. The data is then uploaded to OMS (directly from each agent, even in SCOM attach mode).
In OMS Log Search you can then filter and group data to view information about the top agents and top protocols. Or you can look into when certain computers (IP addresses/MAC addresses) communicated with each other, for how long, and how much data was sent--basically, you view metadata about network traffic, all powered by search – like most other solutions.
The data that the solution produces is pretty self explanatory, if you have been using OMS Log Search and are a little bit familiar with TCP/IP and network communications. Our main goal was that this process should be lightweight – we don’t go extremely deep in the network stack to conserve performance. With default settings we err on the side of dropping something – if necessary - rather than completeness / full fidelity of the data at the expense of performance. This said, the Wire Data module defines certain configuration properties (described later in this post) that can be tweaked.
Type=WireData and Type=SecurityEvent : a ‘better together’ use case
Here I want to illustrate a less obvious use case.
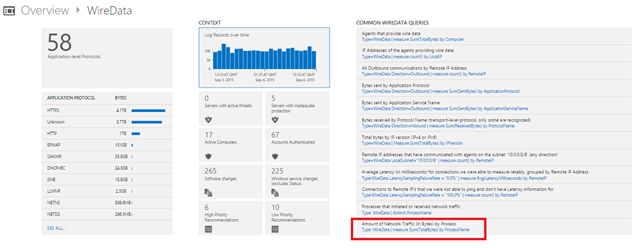
Let’s therefore not spend time on the canned drill down, that currently presents a breakdown of agents, protocols, etc – those should be hopefully self explanatory - and let’s start with one of the ‘Common Queries’ provided, a bit less in view:
Type=WireData | measure Sum(TotalBytes) by ProcessName
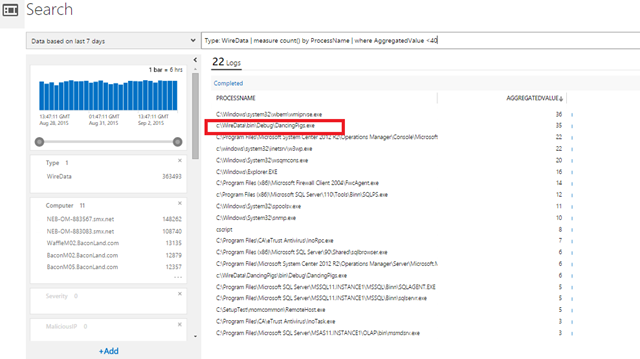
this lets me have a peek at an interesting dimension of this data: we often are able to tell which PROCESS the network communication was sent to/from:
(in the screenshot I added a ‘Where’ as I had too many…)
So here I notice that some traffic was sent from a suspiciously-named process ‘DancingPigs.exe’.
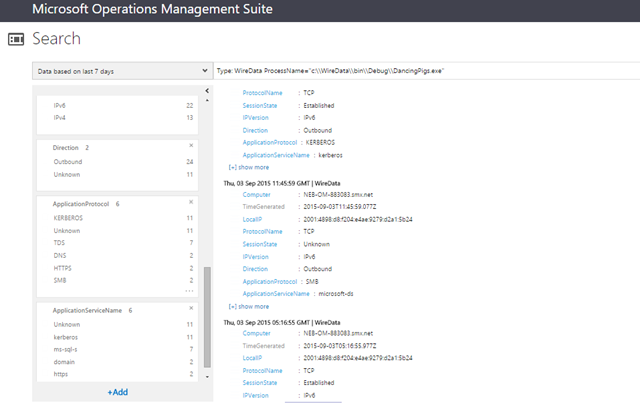
If I click it in the results above I get to the next query, which shows me that traffic:
I can see those are a bunch of ‘outbound’ communications over various protocols (HTTPS, SMB, etc). Sounds like a user has executed something he shouldn’t have clicked on?
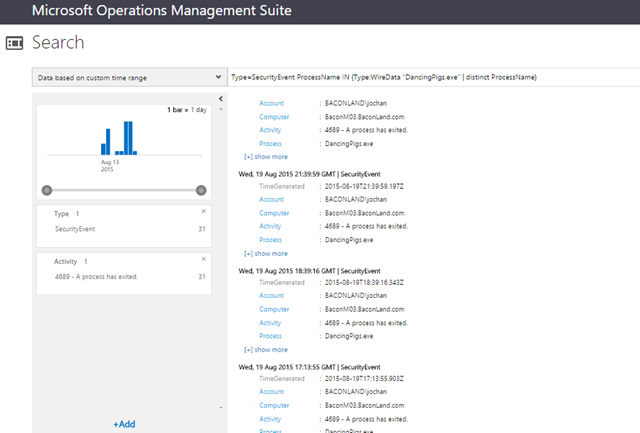
Since I also have the ‘Security and Audit’ solution in this workspace, I can lookup (thru a SUB-SEARCH – read my previous post here if you haven’t) those Security Events which have the SAME ProcessName field value (the field on both types has values in the same format) as those Wire Data logs:
Type=SecurityEvent ProcessName IN {Type:WireData "DancingPigs.exe" | distinct ProcessName}
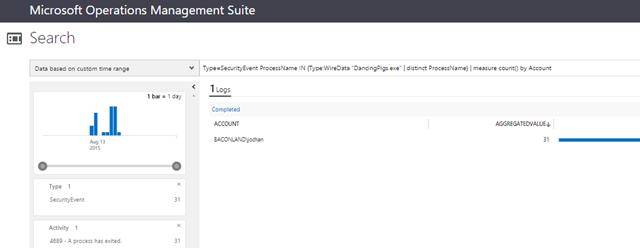
and once I got this information, I can have a look at the Accounts that have started that process, according – again – to the Security Logs:
Type=SecurityEvent ProcessName IN {Type:WireData "DancingPigs.exe" | distinct ProcessName} | measure count() by Account
Hope the above gave a small demonstration of some interesting use case for this type of data.
How is data collected? Can I tweak collection?
As wrote also earlier, the solution uses a custom module for both SCOM and Direct Agent, to hook into the Windows Network Stack and poll statistics from it.
Our main goal was that this process should be lightweight and not affect the agent – therefore we don’t go extremely deep in the network stack to be gentle on machine’s performance. With default settings we err on the side of dropping something – if necessary - rather than having full completeness or fidelity at the expense of performance. This said, the Wire Data module defines the following configuration properties:
Configuration property |
Description |
Default value |
Min value |
Max value |
IntervalSeconds |
This is upload interval of the Wire Data from agent to the cloud storage. |
60 seconds |
1 second |
3600 |
SessionPerUpload |
Max number of sessions to upload. If collected sessions are more than specified value of SessionPerUpload property then those sessions uploaded during next upload interval. |
1000 |
1 second |
262144 (i.e. 256K) |
ExpireIntervalSeconds |
This is to track expire of the session. If the session expired more than value of ExpireIntervalSeconds then those sessions will be discarded and not uploaded to the cloud. |
1800 |
1 |
86400 |
MaxSessionBuffers |
Count of maximum number of session buffers for ETW session created by the WireData Data Source/MP to capture messages. |
32 |
1 |
255 |
SessionBufferSizeKB |
Size of ETW session buffer. |
4096 |
1 |
32768 |
TruncationLengthByte |
Indicates Truncation length. 0 value indicates no truncation. Higher the value of this entry indicates those many bytes will be truncated from the Ethernet packet. |
128 |
0 |
2048 |
MaxCachedSessions |
Maximum number of cached sessions |
16384 |
100 |
1048576 |
LatencySamplingIntervalSeconds |
Sampling interval in seconds for latency calculations |
300 |
1 |
86400 |
LatencySamplingTimeoutSeconds |
Timeout interval of latency sampling |
2 |
1 |
1024 |
LatencySamplingCount |
Indicates sampling count for the latency calculations |
4 |
1 |
10 |
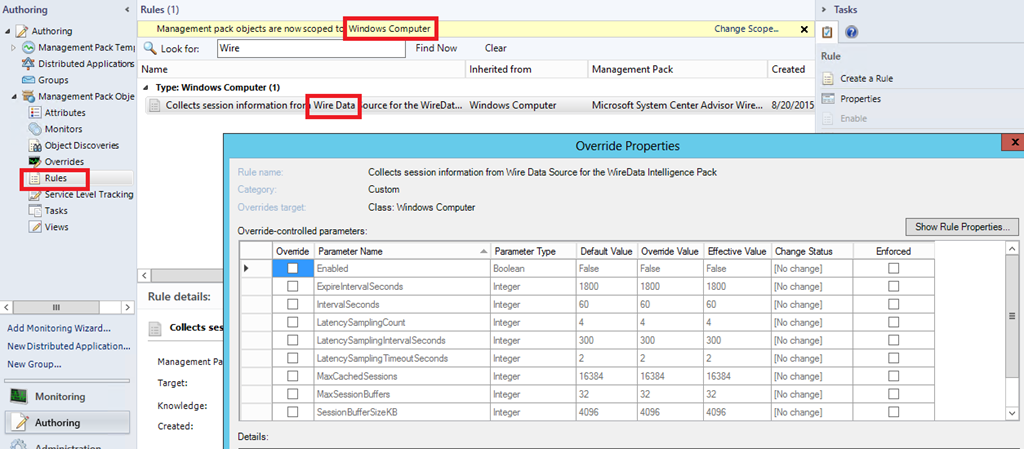
Which means, if you have SCOM, can be tweaked thru Overrides (at your own risk – do your own performance measurement to evaluate the impact of tweaking these limits, especially on busy servers with a lot of traffic.
On behalf of the team, we hope you will enjoy this solution and find it useful. It’s just a first step, ‘getting our toes wet’ into this space of network traffic visibility in OMS.
Please send us feedback and feature requests (or bug reports) as usual on the UserVoice feedback forum.
