Which machines are reporting to Azure Operational Insights? Where is my data coming from? What data and how much is it?
I am sure you have seen our troubleshooting blog post that helps resolve Operational Insights connectivity and data flow issues.
This post aims at showing you how you can use Operational Insights Search to see which machines/environments are sending data, get an understanding of what data (and how much of it) is being received by the service in given amounts of time. This should help with both identifying problematic/missing machines (machines whose data is never seen) and derive an understanding of how the amount of data collected has an impact on usage and billing metrics of the service.
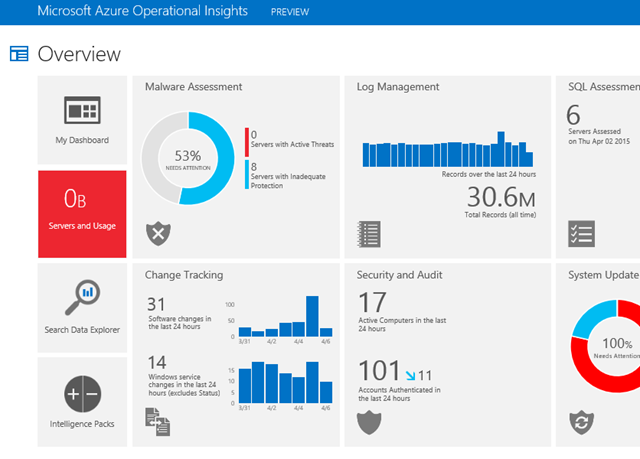
The first place to look at is the ‘Servers and Usage’ tile (one of the ‘small’ tiles in the Overview screen):
This tile shows the amount of data metered during the current metering cycle (which is midnight-to-midnight UTC). If you are already 4 hours into the current day and the count is still on zero, the tile colors red, like in the screenshot above.
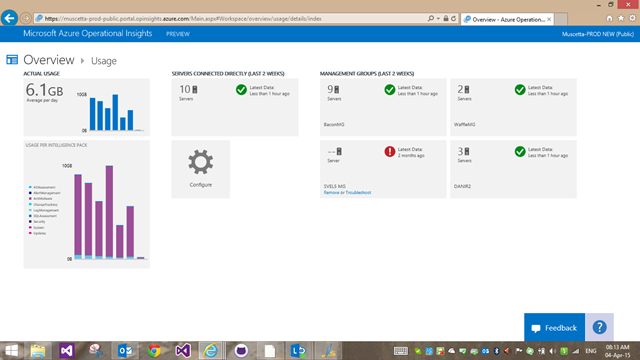
Once you drill into the tile in the respective page – you get additional information about your usage and the amount of data that was metered in the last 7 days, a calculated daily average for those 7 days, and a breakdown of data by Intelligence Pack. Some intelligence packs collect a lot more data than other ones, and some are configurable and can be tuned up or down in this sense (i.e. Log Management). In Operations Manager, you can even create some of your own rules being counted as part of those IP’s, with a more granular collection policy.
Note that usage/metering information is tracked as data as received by the service, accumulated, and updated periodically. The information about ‘usage’ on this page can be slightly stale (1 or 2 hours delay). Information is presented in megabytes/gigabytes here, and broken down by the sending ‘intelligence pack’.
[Edited May 2015 – the list of management groups and the link to access the list of direct agents, described below, have moved to the ‘Settings’ tile, under ‘Connected Sources’]
The other blades in this page show you directly connected agents and Operations Manager management groups that have been registered with Operational Insights.
The list of management groups represents those that are currently registered with the service. You need to register an Operations Manager management group thru the Operations Manager console before it will show up here.
The amount of agents and the ‘data freshness’ status is not actually tracked on our end at this stage, but it is only inferred by the UI based on the presence of data. This is different from the old ‘servers’ page in Advisor (in the Configuration Assessment scenario and screens) that was maintaining a stateful list of all SCOM agents. We don’t actually maintain such a list in the new system – agent management and enrollment is better accomplished from the Operations Manager environment, as machines might naturally come and go there is no need to synchronize them ‘both ways’ as a list in the cloud. We use instead data in Search to see whether data is stamped as belonging to a certain ‘Computer’, and how many and which ones of those we see, to provide counts. Similarly, data freshness uses search: we look at the most recent piece of data for a given management group and report how old that is. We can’t guarantee data for the recent time is complete, just that there is some recent data. More data from the recent period might still being indexed and will show up in the system later.
In the case of management groups, if the last piece of data is older than 2 weeks, we offer a link to ‘remove’ the management groups: this permanently deletes the registration – should that management group ever come back online, its data will be rejected, and you would have to register it again from the Operations Manager console.
Note – for ‘directly connected servers’, we would like to provide an agent management experience that allows to list the agents that have been registered, and eventually remove (de-register) them like you can do with management groups once they are stale. Track this item for that feature https://feedback.azure.com/forums/267889-azure-operational-insights/suggestions/6949226-implemented-feature-to-remove-managed-management
Clicking on either the ‘servers connected directly’ or one of the tiles representing specific Operations Manager management groups takes you to search.
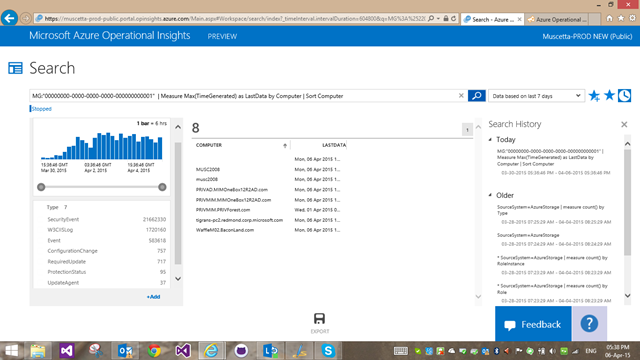
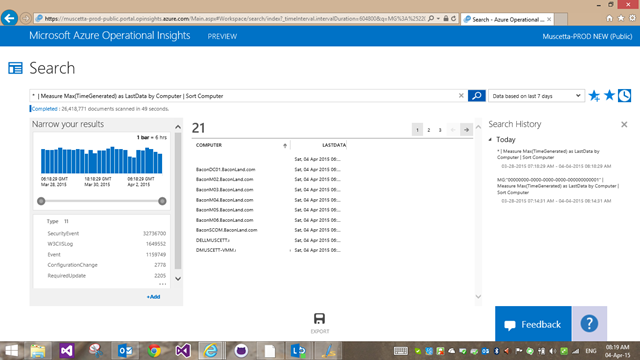
The drill down queries are similar in each case, let’s look at directly connected servers first: Direct agents will be seen as if coming from a fake management group “00000000-0000-0000-0000-000000000001", with this search:
MG:"00000000-0000-0000-0000-000000000001" | Measure Max(TimeGenerated) as LastData by Computer | Sort Computer
The default query uses the Measure command to show the latest indexed piece of data grouped by the field ‘Computer’. Adjusting the time selector to an older period of time might show you more machines that used to report data in the past but might have dropped off. If you never see a machine listed that you expect to see, that’s an indication you need to troubleshoot it.
Note – some log types might not populate the ‘Computer’ field – see requirements for IIS Logs https://blogs.technet.com/b/momteam/archive/2014/09/19/iis-log-format-requirements-in-system-center-advisor.aspx
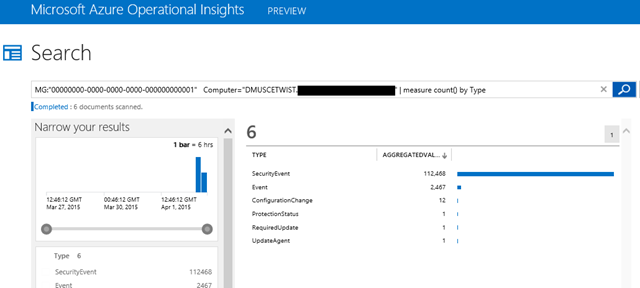
By drilling down into one of the computers, you will see all of its data, and you can then get a breakdown by any of the dimensions in the data with the measure count() command. A first easy assessment to understand what volume of data is to get a count of record grouped by each ‘Type’ (or even more simply, peek at the ‘Type’ facet/filter on the left side under ‘narrow your results’):
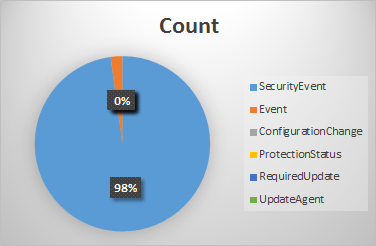
In this screenshot you can see what data my laptop had sent in the first few hours – Security Events and other Windows Events account for the majority of the data, followed by a few configuration changes and just 1 record of each type for those assessment that run infrequently. Exporting this to Excel I can quickly get a percentage and understand what’s the relative ‘weight’ of each Type.
Similar to the ‘servers connected directly’ drill-down, each Operations Manager management group has a similar drill down where the actual (real, in this case) management group ID is used to filter the data.
If you don’t want to look at directly connected agents and Operations Manager agents separately, you can run the same Measure command against a star ‘*’ filter – which means ‘all data’:
* | Measure Max(TimeGenerated) as LastData by Computer | Sort Computer
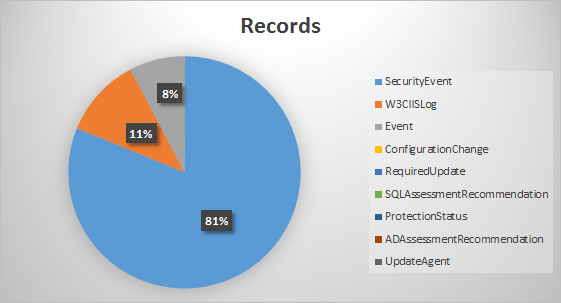
or get the same breakdown by type for the whole environment, to better understand my overall ‘usage’
* | Measure count() by Type
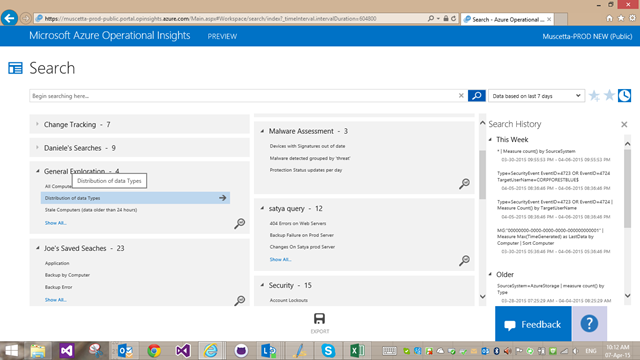
this query is, btw, among the seeded ‘Saved Searches’ in the Portal. It’s under the ‘general exploration’ category, and named ‘Distribution of data types’:
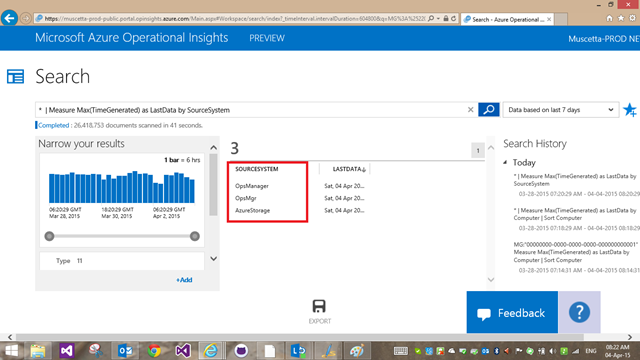
Another interesting field you need to know about is ‘SourceSystem’: since Operational Insights can index data send by agents/management groups or ingest directly from Windows Azure Diagnostics (WAD) storage (typically for PaaS or IaaS Azure role instances), this field tracks where the data comes from. You’ll see there are a couple of varieties of ‘Operations Manager’ (‘OpsManager’, ‘OpsMgr’ – depending on intelligence pack/workflow) that essentially mean this data is ‘agent based’ (either directly connected agent or Operations Manager – but the data comes from the agent-style channel). On the contrary, some data for Log Management is tagged with SourceSystem=AzureStorage, to indicate that data is coming from WAD.
* | Measure Max(TimeGenerated) as LastData by SourceSystem
and besides freshness, you can, again, also see quantities with measure count() command
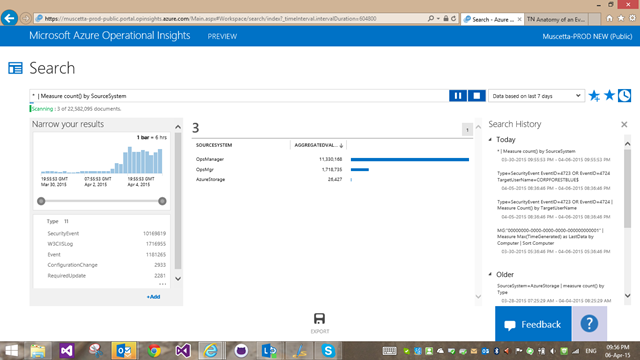
* | Measure count() by SourceSystem
Here you see in my environment, most data is agent-based and only a little is coming from WAD. YMMV.
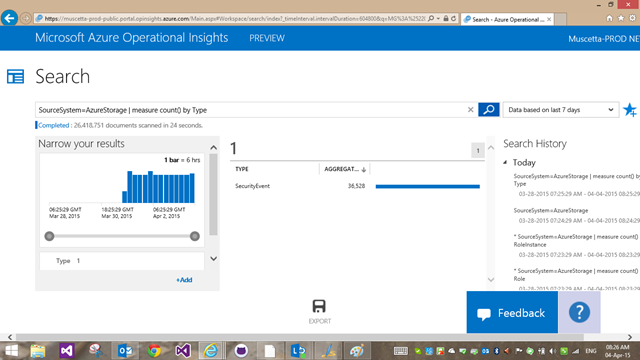
Filtering by SourceSystem=AzureStorage, you can use some of the same techniques above to check what type of data is coming from one type of connection as opposed to the other one.
SourceSystem=AzureStorage | measure count() by Computer
SourceSystem=AzureStorage | measure count() by Type
Last note, records coming from WAD (SourceSystem=AzureStorage) also feature some additional Azure-specific properties, when compared to their agent-based equivalents, i.e. try grouping based on Deployment Id:
SourceSystem=AzureStorage | measure count() by AzureDeploymentID
Often a few more properties (depending on type) are also present referring to Role, RoleInstance and other Azure concepts.
I hope this was useful to understand how to slice and dice your data to understand usage patterns, machines that are not reporting, discover those that are sending the most data, and in general to get a better understanding of what data is flowing in the system.
Happy Searching!
