Azure Operational Insights Search How To: Part IV – Introducing the MEASURE command
This is the fourth installment of a Series (I don’t know yet how many posts they will be in the end, but I have at least 5 in mind at this point…) that walks thru the concepts of Microsoft Azure Operational Insights Search Syntax – while the full documentation and syntax reference is here, these posts are meant to guide your first steps with practical examples. I’ll start very simple, and build upon each example, so you can get an understanding of practical use cases for how to use the syntax to extract the insights you need from the data.
In my first post I introduced filtering, querying by keyword or by a field’s exact value match, and some Boolean operators.
In the second post I built upon the concepts of the first one, and introduced some more complex flavors of filters that are possible. Now you should know all you need to extract the data set you need.
In the third post I introduced the use of the pipeline symbol “|” and how to shape your results with search commands.
Today I will start talking (it will take more than one post) of our most versatile command so far: Measure.
Measure allows you to apply statistical functions to your data and aggregate results ‘grouped by’ a given field. There are multiple statistical functions that Measure supports. it might sound all complicated at this point, but as we walk thru some of them with examples I’m sure they’ll become clearer.
Measure count()
The first statistical we’ll work with (and the simplest to understand) is the count() function.
Given a search query, i.e.
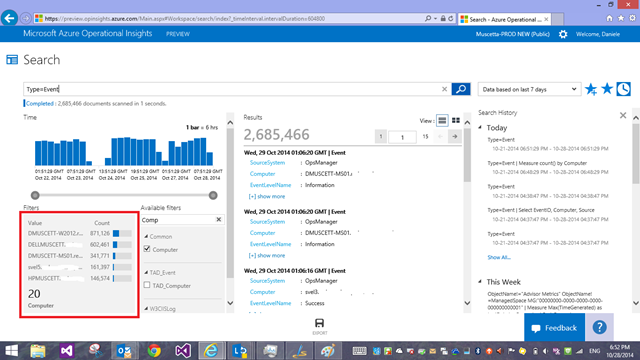
Type=Event
you should already know the ‘filters’ (previously called ‘facets’) on the left end of the screen show you a distribution of values by a given field for the results in the search you executed.
For example in the screenshot above I am looking at the ‘Computer’ field – it tells me that, within the almost 3 million ‘Events’ I got back as results, there are 20 unique/distinct values for the ‘Computer’ field in those records. The tile only shows the top 5 (the most common 5 values that are written in the ‘Computer’ fields), sorted by the number of documents that contain that specific value in that field. From the screenshot I can see that – among those almost 3 million events – 880 thousand come from the DMUSCETT-W2012 computer, 602 thousand from the DELLMUSCETT machine, and so forth…
What if I want to see all values, since the tile only shows only the top 5?
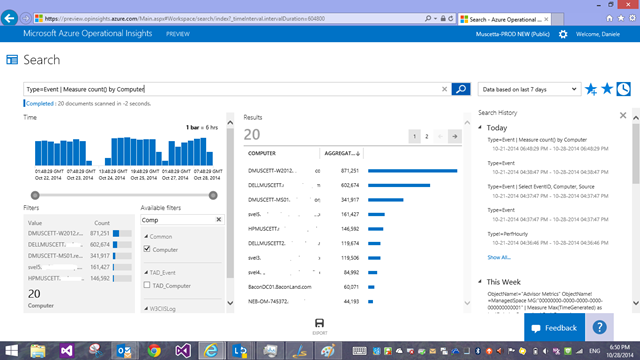
That’s what measure command will let you do with the count() function. This function takes no parameters, and you just specify the field by which you want to ‘group by’ – the ‘Computer’ field in this case:
Type=Event | Measure count() by Computer
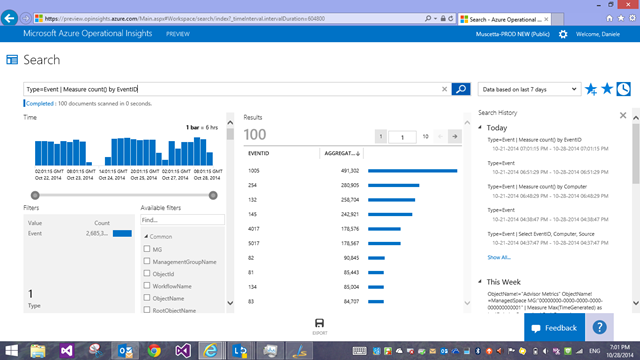
But ‘Computer’ is just a field IN each piece of data – no relational databases here, there is no separate ‘Computer’ object anywhere. Just the values IN the data can talk about which entity generated them, and a number of other characteristics and aspects of the data – hence the term ‘facet’. But you can just as well group by other fields. Since our ‘original’ results (the almost 3 million events that we are piping into the ‘measure’ command) have also a field called EventID, we can apply the same technique to group by that field and get a count of events by EventID:
Type=Event | Measure count() by EventID
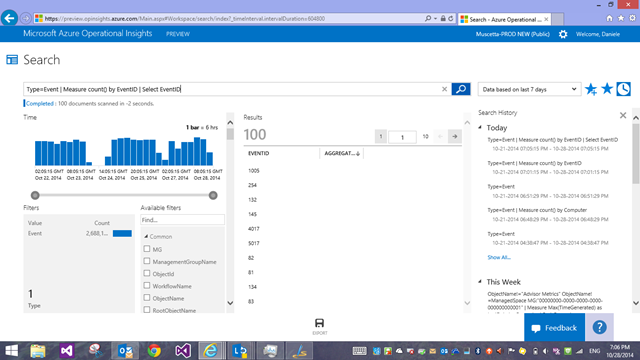
And if you are not interested in the actual ‘count’ of records that contained a specific value, but only want a list of the values themselves, try adding a ‘Select’ command at the end of it and just select the first column:
Type=Event | Measure count() by EventID | Select EventID
and you can even get fancy and pre-sort the results in the query (or you can just click the columns in the grid too)
Type=Event | Measure count() by EventID | Select EventID | Sort EventID asc
You should have gotten the idea with this couple of examples. It should be fairly straightforward. Try doing your own searches featuring the Measure count() now!
There are a couple important things and caveats to notice and/or emphasize:
- The ‘Results’ we are getting are NOT the original ‘raw’ results anymore – they are ‘Aggregated’ results – essentially ‘groups’ of results. Nothing to worry about, just need to understand you are interacting with a very different ‘shape’ of data (different than the original ‘raw’ shape) that gets created on the fly as a result of the aggregation/statistical function.
- Measure count today (at the time of this writing) only returns the TOP 100 distinct results. This limit does not apply to the other statistical functions we’ll talk about later. Anyhow, we have a tracking item on the feedback forum that you might want to vote on if this limit is annoying to you. You typically just have to have a more granular filter first (looking for more specific things), before applying the measure count() command is the workaround you have today for this behavior (i.e. rather than asking for all computers that have reported events, you probably are more interested in just the computer that have reported a SPECIFIC error EventID, and similar scenarios).
In the next installment we’ll look at other statistical functions such as AVG, MIN, MAX, SUM and more!
Till then, happy searching!
Remember that all of the search-related feature requests we have are visible and tracked on the Azure Operational Insights feedback forum in their own category. Come and vote on the ones that matter to you, and suggest your own ideas!


