Azure Operational Insights Search How To: Part II – More on Filtering, using Boolean Operators, the Time Dimension, Numbers and Ranges
[Edited October 27th 2014 - System Center Advisor is now a part of the new Microsoft Azure Operational Insights - Click to learn more]
This is the second installment of a Series (I don’t know yet how many posts they will be in the end) that walks thru the concepts of Microsoft Azure Operational Insights Search Syntax – while the full documentation and syntax reference is here, these posts are meant to guide your first steps with practical examples. I’ll start very simple, and build upon each example, so you can get an understanding of practical use cases for how to use the syntax to extract the insights you need from the data.
In my first post I introduced filtering, querying by keyword or by a field’s exact value match, and some Boolean operators. If you have not read that yet, please do, then come back to this one.
In this second post we’ll build upon those concepts, and try some slightly more elaborate filters.
So we left the other post with a query like
EventLog=Application OR EventLog=System
Since we haven’t specified additional filters, this query will return the entries for both event logs for ALL Computers that have sent such data
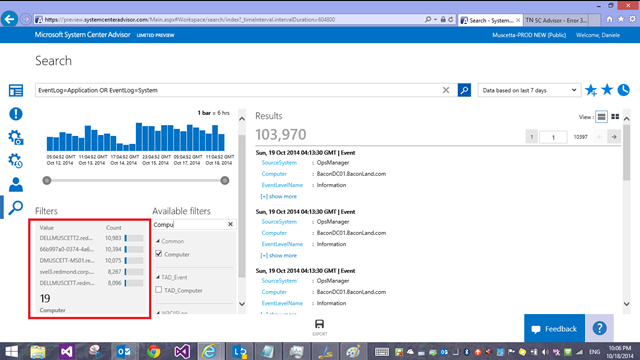
Clicking on one of the fields/filters will narrow down the query to a specific computer, excluding all other ones; the query would become something like
EventLog=Application OR EventLog=System Computer=SERVER1.contoso.com
which, as you’ll remember, given the implicit AND, is the same as
EventLog=Application OR EventLog=System AND Computer=SERVER1.contoso.com
and gets evaluated in this explicit order – look at the parenthesis
(EventLog=Application OR EventLog=System) AND Computer=SERVER1.contoso.com
Now, just like for the event log field, you can bring back data only for a SET of specific machines, by OR’ing them
(EventLog=Application OR EventLog=System) AND (Computer=SERVER1.contoso.com OR Computer=SERVER2.contoso.com OR Computer=SERVER3.contoso.com)
Similarly, this other query will bring back % CPU Time only for the selected two machines
CounterName=”% Processor Time” AND InstanceName=”_Total” AND (Computer=SERVER1.contoso.com OR Computer=SERVER2.contoso.com)
and so forth.
Now, it should be enough with Boolean operators.
Let’s look at something else: with datetime and numeric fields, you can also search for values GREATER THAN, LESSER THAN OR EQUAL, etc – we use the simple operators >, < , >=, <= , != for this.
For example I can query a specific event log for just a specific period of time, i.e. the last 24 hours can be expressed with the mnemonic expression below
EventLog=System TimeGenerated>NOW-24HOURS
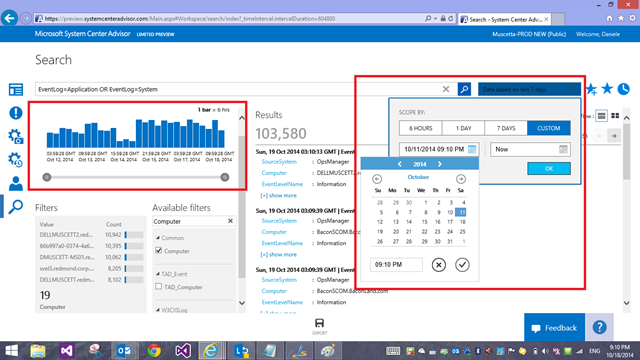
Sure, you can also control the time interval graphically, and most times you might want to do that,
but there are advantages about including a time filter right into the query:
- it works great with dashboards where you can override the time for each tile this way, regardless of the ‘global’ time selector on the dashboard page (Stas already described why this is useful)
- it will be great once we have scheduling of queries to use in a monitoring fashion to periodically ‘keep an eye’ on certain things or KPI’s
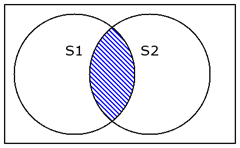
When filtering by time, keep in mind that you get results for the INTERSECTION of the two time windows: the one specified in the UI (S1) and the one specified in the query (S2).
This means, if the time windows don’t intersect (i.e. UX is asking for ‘this week’ and the query is asking for ‘last week’) then there is no intersection and you get no results.
Those comparison operators we used for the TimeGenerated field are also useful in other situations, for example with numeric fields.
For example, given that Advisor Legacy Configuration Assessment’s Alerts have the following Severities: 0 = Information , 1 = Warning , 2 = Critical. You can query for both ‘warning’ and ‘critical’ alerts and exclude informational ones with this query
Type=ConfigurationAlert Severity>=1
Last but not least, we support range queries. This means you can provide the beginning and the end of a range of values in a sequence. Example: Show me the Events from the Operations Manager event log where the EventID is greater or equal to 2100 but no greater than 2199 (these would be Health Service Modules errors mostly around connectivity issues with Advisor, BTW)
Type=Event EventLog="Operations Manager" EventID:[2100..2199]
[Note that for the range syntax you MUST use the ‘:’ colon field:value separator and NOT the ‘equal’ sign, enclose the lower and upper end of the range in square brackets and separate them with two dots ‘..’]
And that’s all for this time around! Hoping you are learning something useful and applicable to your needs with this tutorial, and onto the next post in the series, where I will start looking at the “|” pipeline and begin exploring search commands!
Till then, happy searching!


![Type=Event EventLog="Operations Manager" EventID:[2100..2199] Type=Event EventLog="Operations Manager" EventID:[2100..2199]](https://msdntnarchive.blob.core.windows.net/media/MSDNBlogsFS/prod.evol.blogs.msdn.com/CommunityServer.Blogs.Components.WeblogFiles/00/00/00/41/89/metablogapi/4314.image_thumb_0C51A204.png)