W3C IIS Logs Search in Microsoft Azure Operational Insights
[Edited October 27th 2014 - System Center Advisor is now a part of the new Microsoft Azure Operational Insights - Click to learn more]
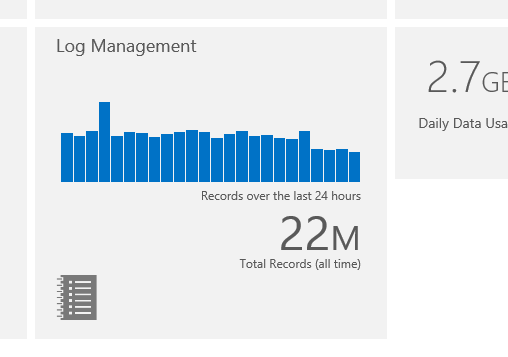
Last week we enabled the collection of IIS Logs from your Operations Manager agents into System Center Advisor. if you are already using Advisor, you’ll notice we don’t just talk about how many ‘events’ are there, on the Log Management tile, anymore, but we rephrased it to ‘Records’. This is a small but important tweak, as we will be adding more and more configurable data sources.
If you are on Advisor Preview, and you have an opinion on which data sources we should be adding (com’on – I know you have an opinion!), then from the Advisor Portal, click on the ‘Feedback’ button and then use this link to see what ideas are already in the backlog https://feedback.azure.com/forums/267889-azure-operational-insights/category/88086-log-management-and-log-collection-policy or add/suggest the ones you would like to see!
And if you are not yet using Advisor – head to our Onboarding Instructions page and Try it out!
Back to the newly released feature (W3C IIS Logs collection and search), once you have an Advisor account, just follow what Joseph blogged about in order to configure IIS log collection https://blogs.technet.com/b/momteam/archive/2014/09/19/collect-amp-search-iis-log-in-advisor.aspx
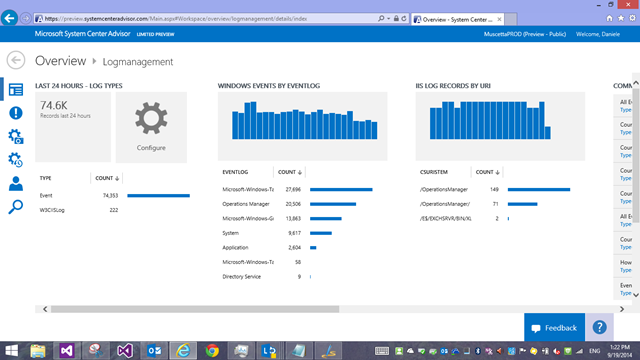
Once you have some data collected and you drill into the Log management page, we now have a breakdown by type (you see where this is going) and then specialized blades with other breakdowns by event log, by URI, and sample searches ready to use.
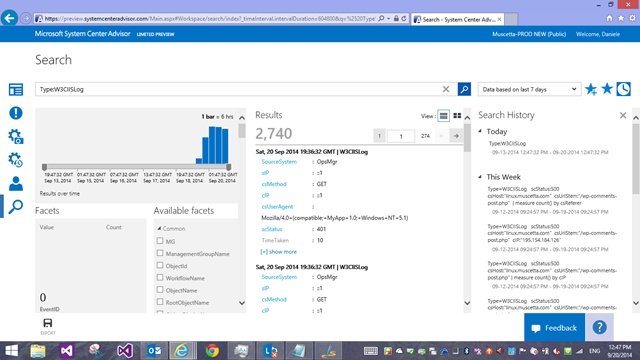
So, let’s delve into Search. The most basic search you can write for IIS logs would be clicking on the first blade ‘Log Types’ – in the screenshot it says I have a count of 222 ‘W3CIISLog’ records in the last 24 hours. Let’s click on that, which lands me to search with this query
Type=W3CIISLog
This will bring back all records. Notice that once we land in the search page, the default time interval is now 7 days, not 24 hours anymore like in the page you came from.
Nice, but I now want to get a breakdown of these log entries by client IP Address, and see which one downloaded (received) the most data from our sites/servers.
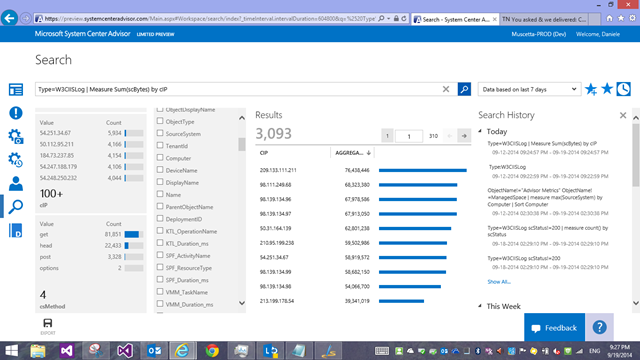
Easy! Using our Measure command with the Sum() statistical function! I add a vertical pipe “|” character after the query filter and my measure command
Type=W3CIISLog | Measure Sum(scBytes) by cIP
How did I know the field name? Well, the facets/filters on the left end of the screen also show distribution of various field’s values in those log entries, and the entries themselves can be explored/viewed to look at the field names. For IIS specifically, the field names we use are slightly modified versions of the field names in the original IIS log, because we preferred not having dashes in the names, so we went with camelCase: if the original IIS field name was ‘cs-host’ it now becomes ‘csHost’; ‘s-ip’ becomes ‘sIP’ and so forth. You should be able to mentally map them fairly easily.
As for the search query syntax, you can find it on TechNet https://go.microsoft.com/fwlink/?LinkId=394544
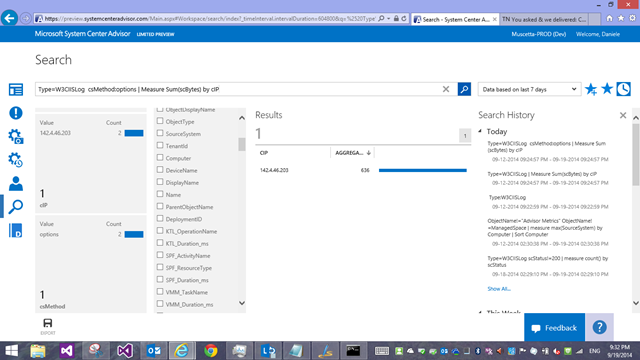
Now, by looking at my facets above, I notice 2 requests with the ‘options’ method: normal web site visits wouldn’t be using that method on my server, so this must be someone scanning/fingerprinting the server (only my server, or maybe someone is scanning and entire network to see which IPs have webservers of some sort running. So let’s click on the facet, and the query becomes
Type=W3CIISLog csMethod=options | Measure Sum(scBytes) by cIP
and this brings down our query to the one IP address issuing those requests:
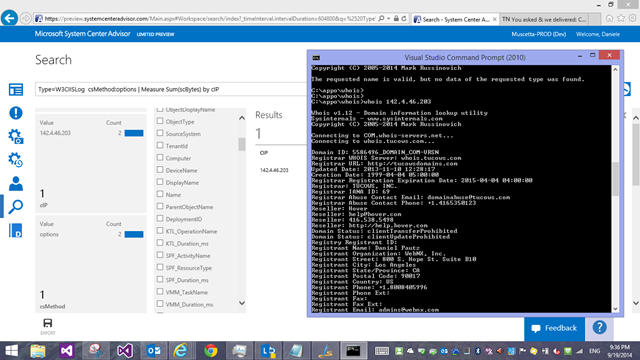
What I find very handy, when looking at traffic logs, is to know my visitors: who are those IP addresses? That’s why I normally have the whois.exe utility from Windows Sysinternals handy (or you can use an online whois service)
So we know who this scan came from. But what else did this IP do? Let’s drill into the IP address, and remove the filter for the method – to see every request from that IP (if this was part of a larger scan)… in this case, we found no other activity from that address. We can’t really do anything in this case about it, and we move on. But now you could go back a couple of steps (using the query history on the right end side of the search screen – Tip: toggle it with the ‘clock’ icon) and continue investigating what the next client IP did, and so forth.
I hope I gave you a sense of how to move around W3CIISLogs in a security-type investigation.
What about troubleshooting scenarios for a website/webserver?
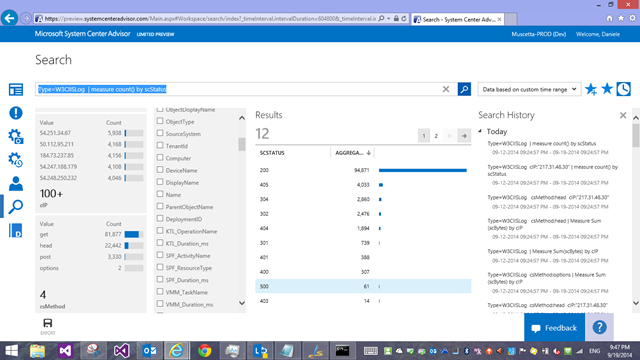
I could get a breakdown of requests by HTTP status code the server has returned
Type=W3CIISLog | measure count() by scStatus
and lets’ see I want to start investigating what those ‘500’ errors were…a few clicks, a few changes to my query it becomes
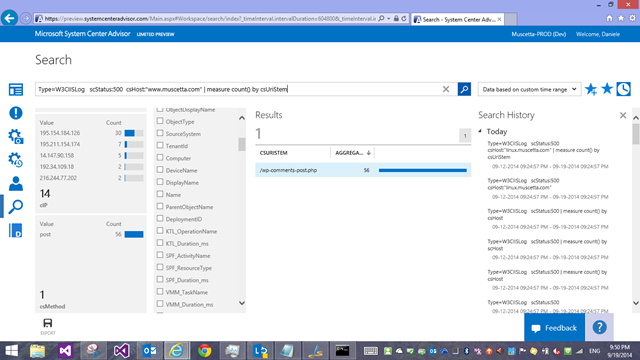
Type=W3CIISLog scStatus:500 csHost:"www.muscetta.com" | measure count() by csUriStem
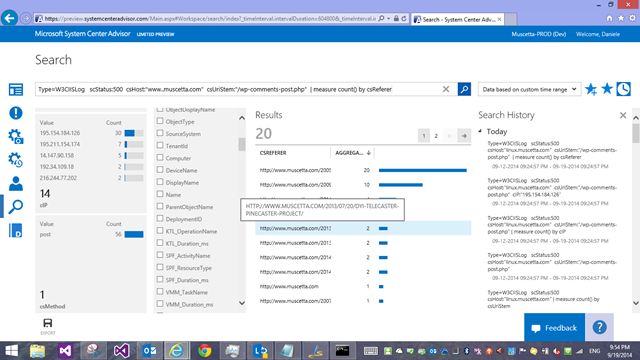
which shows me that (based on the facets) 14 IP addresses have been getting ‘500’ back on the wordpress comments page – so either my comments don’t work, or these were spam attempt that were blocked, and with some other twist of the query, I can see which actual blog posts on my site the comments were meant to be for
Type=W3CIISLog scStatus:500 csHost:"www.muscetta.com" csUriStem:"/wp-comments-post.php" | measure count() by csReferer
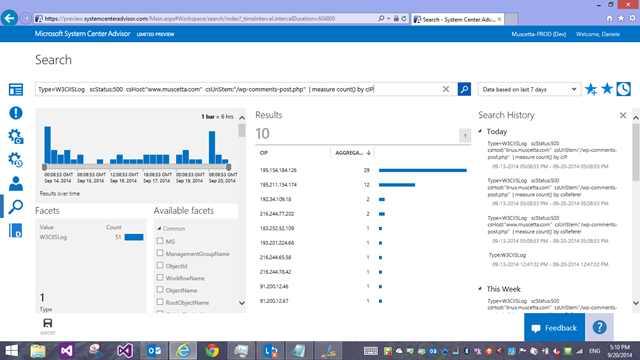
And I can check how many unique IP addresses are being failing to post comments
Type=W3CIISLog scStatus:500 csHost:"www.muscetta.com" csUriStem:"/wp-comments-post.php" | measure count() by cIP
These are just some very basic examples to get you warmed up and give you a sense of what you can do and how you can interact with the logs – Have fun searching your own W3C logs, and let us know what you think of Advisor by going to the ‘Feedback’ button.
