Compressing messages in WCF part three - Performance analysis
In this post, I will run a client and service with the GZipMessageEncoder on the same machine and analyze the performance.
The WCF sample application for GZipMessageEncoder has been suitable up until now for functional testing. For performance testing, I will be using a harness we commonly use for WCF testing inside Microsoft. I cannot release the code for this harness, but you can definitely create your own that suits your needs. The function of the test harness is to coordinate the client and service so they start testing when both are up and ready. It also has a warmup period, configured for 10 seconds, that helps clear up any initialization or JIT issues. The test itself runs for 20 seconds.
Since there is only one client and one service and the client waits for the service's response, the test will only use the equivalent of one CPU core. The specs of the machine I'm using are an AMD Athlon 64 X2 Dual Core 4200+ @ 2.20 GHz with 6 GB ram on Windows Server 2008 R2 64 bit.
The test itself is very simple. The client sends a request containing an integer n. The service responds with a collection of n Order objects. Therefore the client message is very small and the size of the response can be changed at will. To eliminate GC costs for creating the objects, the objects are created in a static constructor and buffered. It is bad to make all the objects the same due to the nature of the compression. If every object is the same, the compression will work extremely well but that would not be representative of real-world messages. In that case, it is best to randomize the objects. However, the problem with randomization is that it makes each test run have potentially different results. To avoid these problems a collection of 1000 random Order objects was created and then serialized to XML. That XML is kept as an embedded resource in the service assembly. For your own testing, it is best to grab serialized versions of real messages you will be sending (scrubbing out sensitive data of course).
The Order object looks like this:
 [DataContract]
public partial class Order
{
    [DataMember(Order = 0)]
    public int CustomerID;
    [DataMember(Order = 1)]
    public string ShippingAddress1;
    [DataMember(Order = 2)]
    public string ShippingAddress2;
    [DataMember(Order = 3)]
    public string ShippingCity;
    [DataMember(Order = 4)]
    public string ShippingState;
    [DataMember(Order = 5)]
    public string ShippingZip;
    [DataMember(Order = 6)]
    public string ShippingCountry;
    [DataMember(Order = 7)]
    public string ShipType;
    [DataMember(Order = 8)]
    public string CreditCardType;
    [DataMember(Order = 9)]
    public string CreditCardNumber;
    [DataMember(Order = 10)]
    public DateTime CreditCardExpiration;
    [DataMember(Order = 11)]
    public string CreditCardName;
    [DataMember(Order = 12)]
    public OrderLine[] OrderItems;
}

[DataContract]
public partial class OrderLine
{
    [DataMember(Order = 0)]
    public int ItemID;
    [DataMember(Order = 1)]
    public int Quantity;
}
Note that I am using the Order parameter in DataMember. That is not necessary. You will see that this is useful in later posts when we get to Protocol Buffers.
Back to the testing, I'll use Release mode to do all of the test runs. There is a 10 second warmup followed by a 20 second run. The throughput measurement is taken during the 20 second run. The binding uses a binary message encoder on a TCP transport. The compression option is GZip.
| # Orders | Uncompressed | Compressed | % diff |
|---|---|---|---|
| 10 | 1382.75 | 755.60 | 45.36 |
| 100 | 358.50 | 232.38 | 35.18 |
| 1000 | 41.48 | 27.64 | 33.37 |
We can see that the effect of compression lessens as the message gets larger. Let's examine this using Visual Studio profiling. The first thing to do is go to the Tools->Options menu and enable the Microsoft public symbol server.
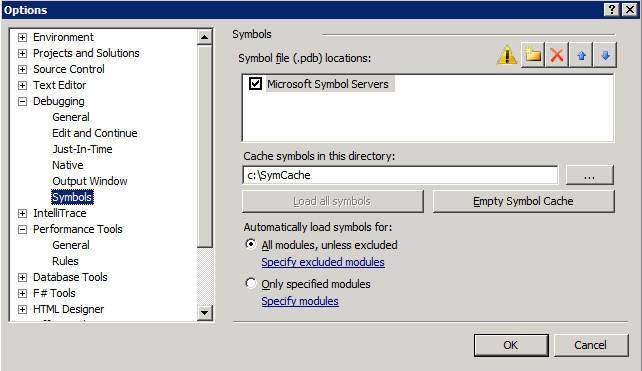
You should use a similar configuration so you can see what's going on inside the framework. When I ran my performance tests, I went to Analze->Profiler->New Performance Session. Then I attached to the client and service processes separately to do the profiling. Note that I selected an area that does not include the startup and tear down and also enabled the "Show All Code" option. Here is the profile summary from the service side:
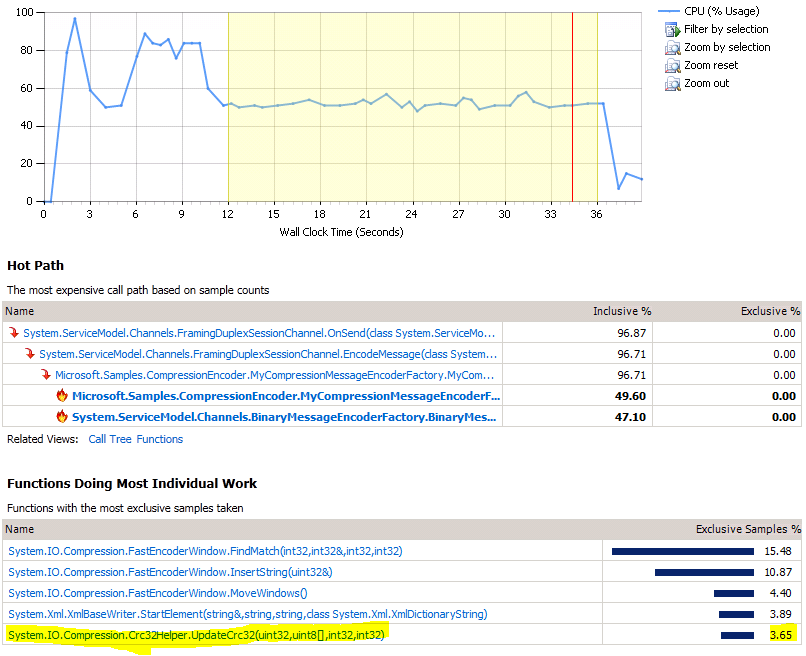
Highlighted above is a method responsible for creating the CRC. If you recall, the difference between GZip and Deflate is that GZip has a header and a CRC. We can switch to Deflate and get back the 3.65% shown above. To confirm this, we can also see it on the client side:
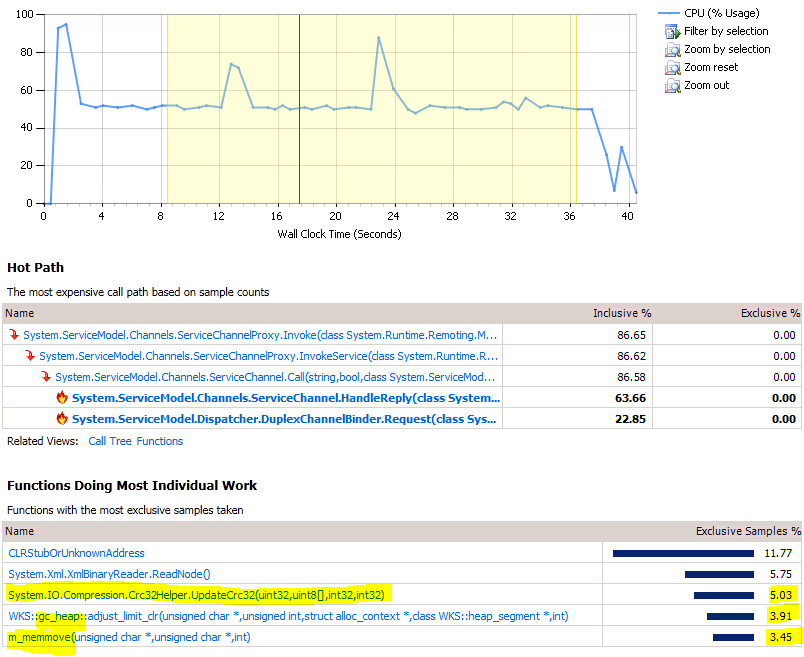
Notice that the CRC method takes about 5% exclusive time. I also highlighted a couple of functions involved in garbage collection. This can be expected for the client side because we're de-serializing objects and then throwing them away rapidly.
Let's add the Deflate numbers to our previous table:
| # Orders | Uncompressed | GZip | % diff | Deflate | % diff |
|---|---|---|---|---|---|
| 10 | 1382.75 | 755.60 | 45.36 | 788.99 | 42.94 |
| 100 | 358.50 | 232.38 | 35.18 | 243.98 | 31.94 |
| 1000 | 41.48 | 27.64 | 33.37 | 28.67 | 30.88 |
We can see that Deflate gives us a slight advantage over GZip. It is unlikely that the CRC check will be necessary for most situations so using Deflate should be safe.
In the next post, I'll show how this encoder stands up in a real client/server situation where network bandwidth can become a factor.