Checking a dump file for WCF throttles
The ServiceModel performance counters can tell you how many concurrent calls, instances, and sessions you have. In .Net 4.0, more counters were added to tell you how close you are to the throttles for each of those categories. So if you're trying to performance tune an application, those performance counters would be the way to go. But if you're trying to look at something after-the-fact, you may only have a dump file. Here are some tricks for examining the memory of that dump file to find out if you're hitting your throttles.
The first thing you need is the dump file. This may have been captured by someone else or you may have to get one yourself. I will not cover how to get one of those. There are plenty of resources on how to do that. You can also attach to a live process, it doesn't have to be dump file. The second thing to obtain is windbg. Quickest way to get this is to go windbg.org. There you will find download links for windbg, the path for the Microsoft public symbol server, and many helpful links including a handy cheat sheet for crash dump analysis.
Assuming windbg is setup, we just need to open the crash dump file:
windbg.exe -z MyCrashDump.dmp
You'll see the following familiar windbg screen:
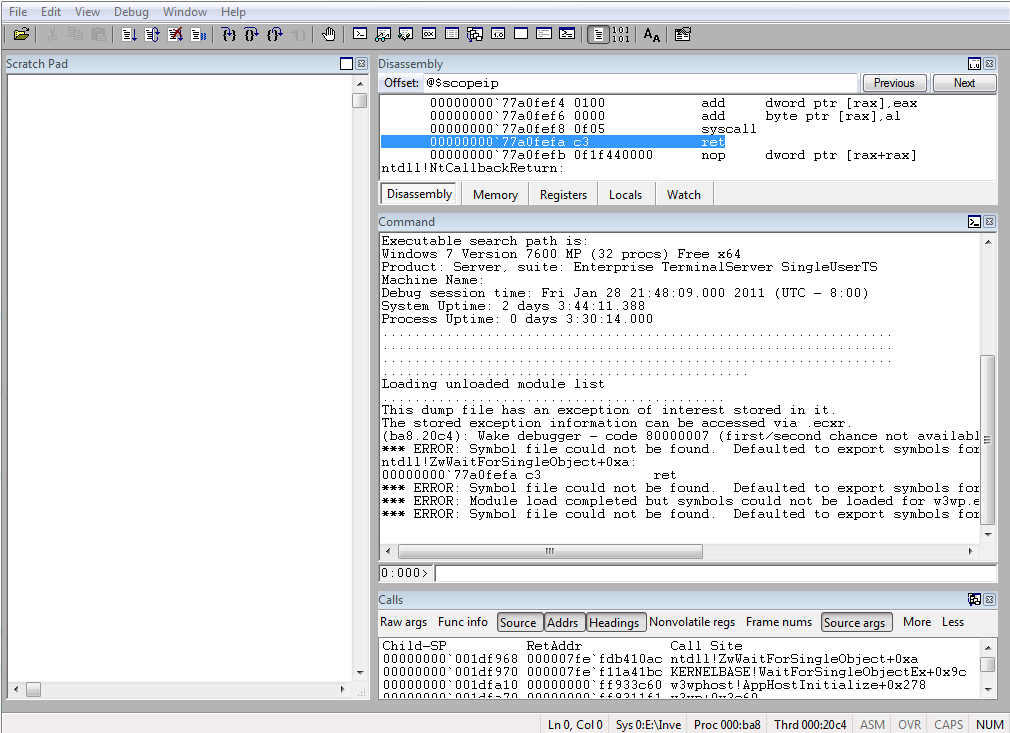
If windbg isn't familiar, that's not a problem for the purposes of this blog. The left side is the scratch pad and you can throw whatever text you want in there. It's more convenient than having notepad open but it does take some real estate. The right side is divided into three sections. For the work here, we only need to use the middle section for entering commands. The other two can be closed if you want.
The first thing to do is setup the symbol path. Windbg.org has the Microsoft public symbol server path, so we'll just set that by typing in the following command:
.sympath srv*E:\SymCache*https://msdl.microsoft.com/download/symbols
I use E:\SymCache as my symbol cache. Be sure to adjust this to wherever you want your symbol cache to be. With that done, reload the symbols by typing:
.reload
Next, load the SOS module which will help you debug managed code. If the process was using .Net 3.5 or earlier, type:
.loadby sos mscorwks
If the process was using .Net 4.0 (or later), type:
.loadby sos clr
At any time after this, you can type !help to see a list of SOS commands. If you've ever read Tess's blog, then you're probably aware of the !analyze command. We won't be using that here since we're after specific WCF information.
Next, let's find our WCF throttles by searching for FlowThrottle in the heap:
!dumpheap -type FlowThrottle -stat
Be careful that the capitalization is correct as this is a case-sensitive search. This should produce output similar to the following:
Statistics: MT Count TotalSize Class Name000007feee769c00 3 192 System.ServiceModel.Dispatcher.FlowThrottleTotal 3 objects
There should be three throttles per service. What this gives us is the MT or MethodTable of the FlowThrottle class. If you used a value for !dumpheap -type like Throttle or Queue, you might get a lot of types in the heap that have that in their class name. The MT will point you to a specific class. In this case, we can use MT to show just the objects were interested in. So, we'll dump the heap again but have it show only the FlowThrottle objects:
0:000> !dumpheap -mt 000007feee769c00 ------------------------------Heap 0 Address MT Size00000002af96ea50 000007feee769c00 64 00000002af96eb80 000007feee769c00 64 00000002afe2c710 000007feee769c00 64 total 3 objectsStatistics: MT Count TotalSize Class Name000007feee769c00 3 192 System.ServiceModel.Dispatcher.FlowThrottleTotal 3 objects
We could try to dump each individual object one-at-a-time by grabbing the address and using the !do (shorthand for !dumpobj) command:
0:000> !do 00000002af96ea50 Name: System.ServiceModel.Dispatcher.FlowThrottleMethodTable: 000007feee769c00EEClass: 000007feee12c950Size: 64(0x40) bytes (C:\Windows\assembly\GAC_MSIL\System.ServiceModel\3.0.0.0__b77a5c561934e089\System.ServiceModel.dll)Fields: MT Field Offset Type VT Attr Value Name000007fef7865f00 4003569 30 System.Int32 1 instance 512 capacity000007fef7865f00 400356a 34 System.Int32 1 instance 96 count000007fef785e580 400356b 8 System.Object 0 instance 00000002af96ea90 mutex000007fef78a3540 400356c 10 ...ding.WaitCallback 0 instance 00000002af96ea10 release0000000000000000 400356d 18 0 instance 00000002af96eaa8 waiters000007fef785ec90 400356e 20 System.String 0 instance 00000002af96e930 propertyName000007fef785ec90 400356f 28 System.String 0 instance 00000002af96e9d0 configName
Here I can see that this throttle has a capacity of 512 and a count of 96. So we're not hitting this throttle. But I'd rather just print out all these objects at one time. To do this, we'll first look at the output if we add -short to our !dumpheap command:
0:000> !dumpheap -mt 000007feee769c00 -short00000002af96ea50 00000002af96eb80 00000002afe2c710 ------------------------------
This dumps out the object addresses only. Unfortunately it also sticks that line of dashes at the end but we can live with that. We can use a for loop in windbg to dump each object's contents in one shot:
0:000> .foreach (myobj {!dumpheap -mt 000007feee769c00 -short}) {!do ${myobj}} Name: System.ServiceModel.Dispatcher.FlowThrottleMethodTable: 000007feee769c00EEClass: 000007feee12c950Size: 64(0x40) bytes (C:\Windows\assembly\GAC_MSIL\System.ServiceModel\3.0.0.0__b77a5c561934e089\System.ServiceModel.dll)Fields: MT Field Offset Type VT Attr Value Name000007fef7865f00 4003569 30 System.Int32 1 instance 512 capacity000007fef7865f00 400356a 34 System.Int32 1 instance 96 count000007fef785e580 400356b 8 System.Object 0 instance 00000002af96ea90 mutex000007fef78a3540 400356c 10 ...ding.WaitCallback 0 instance 00000002af96ea10 release0000000000000000 400356d 18 0 instance 00000002af96eaa8 waiters000007fef785ec90 400356e 20 System.String 0 instance 00000002af96e930 propertyName000007fef785ec90 400356f 28 System.String 0 instance 00000002af96e9d0 configNameName: System.ServiceModel.Dispatcher.FlowThrottleMethodTable: 000007feee769c00EEClass: 000007feee12c950Size: 64(0x40) bytes (C:\Windows\assembly\GAC_MSIL\System.ServiceModel\3.0.0.0__b77a5c561934e089\System.ServiceModel.dll)Fields: MT Field Offset Type VT Attr Value Name000007fef7865f00 4003569 30 System.Int32 1 instance 3200 capacity000007fef7865f00 400356a 34 System.Int32 1 instance 0 count000007fef785e580 400356b 8 System.Object 0 instance 00000002af96ebc0 mutex000007fef78a3540 400356c 10 ...ding.WaitCallback 0 instance 00000002af96eb40 release0000000000000000 400356d 18 0 instance 00000002af96ebd8 waiters000007fef785ec90 400356e 20 System.String 0 instance 00000002af96e970 propertyName000007fef785ec90 400356f 28 System.String 0 instance 00000002af96eaf8 configNameName: System.ServiceModel.Dispatcher.FlowThrottleMethodTable: 000007feee769c00EEClass: 000007feee12c950Size: 64(0x40) bytes (C:\Windows\assembly\GAC_MSIL\System.ServiceModel\3.0.0.0__b77a5c561934e089\System.ServiceModel.dll)Fields: MT Field Offset Type VT Attr Value Name000007fef7865f00 4003569 30 System.Int32 1 instance 3712 capacity000007fef7865f00 400356a 34 System.Int32 1 instance 96 count000007fef785e580 400356b 8 System.Object 0 instance 00000002afe2c750 mutex000007fef78a3540 400356c 10 ...ding.WaitCallback 0 instance 00000002afe2c6d0 release0000000000000000 400356d 18 0 instance 00000002afe2c768 waiters000007fef785ec90 400356e 20 System.String 0 instance 00000002afe2c688 propertyName000007fef785ec90 400356f 28 System.String 0 instance 00000002af98a030 configNameUnknown option: ------------------------------
So now we can see each object. But I don't know which throttle is which. There is a field called propertyName that would tell us the throttle's name. Let's dump the last one:
0:000> !do 00000002afe2c688 Name: System.StringMethodTable: 000007fef785ec90EEClass: 000007fef746b038Size: 70(0x46) bytes (C:\Windows\assembly\GAC_64\mscorlib\2.0.0.0__b77a5c561934e089\mscorlib.dll)String: MaxConcurrentInstancesFields: MT Field Offset Type VT Attr Value Name000007fef7865f00 4000096 8 System.Int32 1 instance 23 m_arrayLength000007fef7865f00 4000097 c System.Int32 1 instance 22 m_stringLength000007fef78606d8 4000098 10 System.Char 1 instance 4d m_firstChar000007fef785ec90 4000099 20 System.String 0 shared static Empty >> Domain:Value 00000000014f4860:000000029f940370 000000000382feb0:000000029f940370 <<000007fef7860588 400009a 28 System.Char[] 0 shared static WhitespaceChars >> Domain:Value 00000000014f4860:000000029f940ac0 000000000382feb0:000000029f9489e8 <<
We can see that the last throttle is for max concurrent instances. But there's a lot of extra garbage around here. And if we can loop through each object and call !do on it, what else can we do? Here's one helpful command I came up with that puts the property name, count, and capacity of each throttle in one package:
0:000> .foreach (myobj {!dumpheap -mt 000007feee769c00 -short}) {!do -nofields poi(${myobj}+20);dd ${myobj}+34 L1;dd ${myobj}+30 L1}
Name: System.String
MethodTable: 000007fef785ec90
EEClass: 000007fef746b038
Size: 62(0x3e) bytes
(C:\Windows\assembly\GAC_64\mscorlib\2.0.0.0__b77a5c561934e089\mscorlib.dll)
String: MaxConcurrentCalls
00000002`af96ea84 00000060
00000002`af96ea80 00000200
Name: System.String
MethodTable: 000007fef785ec90
EEClass: 000007fef746b038
Size: 68(0x44) bytes
(C:\Windows\assembly\GAC_64\mscorlib\2.0.0.0__b77a5c561934e089\mscorlib.dll)
String: MaxConcurrentSessions
00000002`af96ebb4 00000000
00000002`af96ebb0 00000c80
Name: System.String
MethodTable: 000007fef785ec90
EEClass: 000007fef746b038
Size: 70(0x46) bytes
(C:\Windows\assembly\GAC_64\mscorlib\2.0.0.0__b77a5c561934e089\mscorlib.dll)
String: MaxConcurrentInstances
00000002`afe2c744 00000060
00000002`afe2c740 00000e80
Invalid parameter -nofields poi(------------------------------+20)
00000000`00000034 ????????
00000000`00000030 ????????
Notice the annoying dashed line at the end of the !dumpheap still gives us grief. Eventually you just stop seeing it. Also, note that the numbers are printed in hex. Not quite as nice as the !do output, but it serves the purpose. Breaking down the .foreach statement above, you can see that instead of doing !do ${myobj} , I run three separate commands per loop iteration (separated by semicolons). In each of these commands I add ( ${myobj}+offset) the offset for the field, which I got from the !do of one of the objects. The first command uses poi because we need that to get SOS operations to work. POI stands for point of indirection and is kind of like dereferencing a pointer. The other two commands print DWORD values (4-bytes) and don't need POI. These are native debugger commands and not part of an extension library so they don't have the leading ' ! '.