Slow AppFabric demo part one
Back in the early days of AppFabric, when it was still just Dublin and Velocity, a demo was given to the management team that started with a simple xamlx workflow. You can probably imagine the concern as a room full of managers silently waited for this very simple workflow to come up. The reports vary on how long it actually took to get a response from the server: anywhere from 40 seconds to a couple minutes. Repeating the test showed it was more like 30 seconds. Still, that can be a really uncomfortable silence when it's your product and you're getting close to a release date. I got the chance to do the performance investigation to find out why it took so long to respond and what action items to take from there.
The demo was hosted on a virtual machine running Windows Server 2008 R2 and was run in a "cold startup" configuration. This means that the machine was recently rebooted and no programs were run before the demo. Since we were working with the .Net 4.0 framework, which hadn't yet been released, it was unlikely that any of the programs loaded on startup used the .Net 4.0 CLR. The reason this is important is because the framework assemblies are shared. So the first process to load them will pay the price for all the disk access while subsequent processes can usually share the memory. Also, being on W2K8 R2 means that there is no SuperFetch like there would be on Windows 7 client.
The next strike against this virtual machine was that the .Net 4.0 framework had been installed but the assemblies had not yet been NGEN'd. If you are unfamiliar with NGEN, each assembly is basically compiled to match the processor architecture. If you do not NGEN an assembly, then the CLR will use JIT at runtime. For throughput scenarios, this is not usually a problem because once the JIT is finished, you'll never have that cost again for that code. But for cold latency, it is a problem. As part of a push to improve the speed at which the .Net framework is installed, NGEN is not performed during the installation of the framework. Instead, each assembly is "scheduled" for an NGEN. This is handled by a Windows service with the display name "Microsoft .NET Framework NGEN v4.0.30319_X86". It waits until the machine is idle and NGENs the assemblies in the background. So, instead of loading NGEN assemblies, it loads GAC assemblies. Besides not having to perform JIT, another benefit of NGEN is that the pages are ordered in such a way that the most commonly used code is placed earlier in the assembly and it can therefore cut down on the number of page faults and working set size. This is not something that happens for every assembly though, only the .Net framework assemblies.
To force NGEN to compile the assemblies, simply use the ngen.exe tool in the framework directory (under \windows\Microsoft.Net) by running "ngen update". Before performing "ngen update", the cold startup scenario took about 28 seconds. Afterwards, it took 21 seconds. There was also a significant chunk of time spent loading assemblies referenced in the root web.config and machine.config. To reduce noise, I cut out the ones that were not essentially to the demo. This is not something I would recommend for most users as the downsides are usually greater than the upsides. But, in this case I had reduced the 21 seconds down to 18.5 seconds.
To find out where these 18.5 seconds were spent, I took an ETW trace. ETW is my favorite performance tool because not only do you get a system-wide view of what's going on, you can also pick from all kinds of providers to focus on information you want to gather. Since Dublin uses IIS and WCF/WF, I used those providers and collected stack traces (something I'll talk about in a later post). To take the trace, I used xperf, which is now part of the Windows SDK, and included the following providers:
 Microsoft-Windows-IIS-W3SVC                        {05448E22-93DE-4A7A-BBA5-92E27486A8BE}
Microsoft-Windows-Application Server-Applications  {C651F5F6-1C0D-492E-8AE1-B4EFD7C9D503}
The "Server-Applications" provider is the one used for WCF/WF events. With latency scenarios, it is very easy to see where the time is spent as the ETW events can demarcate individual areas of execution.
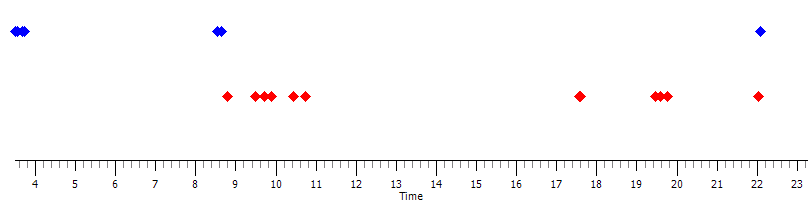
This graph is what you would see by using xperfview (or xperf /view). The blue dots indicate activity in IIS, the red dots are WCF/WF. It is pretty clear from this graph where the handoffs are between IIS and WCF, as well as that the majority of time is spent in WCF. We can use the xperf tool to check the stack traces during each time period. Let's first look at the time when IIS is starting up, before it hands off to WCF. Here are the stacks and inclusive times during that time period:
13% | | => webengine4.dll!GetIsapiProcessHost
10% | | |clr.dll!ClrCreateManagedInstance
3% | | ||clr.dll!EnsureEEStarted
3% | | || clr.dll!EEStartup
2% | | || clr.dll!EEStartupHelper
2% | | || Other
7% | | ||clr.dll!TypeName::GetTypeUsingCASearchRules
7% | | | ...clr.dll!TypeName::GetTypeWorker
6% | | | clr.dll!LoadDomainAssembly
6% | | | => clr.dll!AssemblySpec::LoadDomainAssembly
43% | | => System.Web.ni.dll!System.Web.Hosting.ApplicationManager::CreateAppDomainWithHostingEnvironment
2% | | |System.Web.ni.dll!System.Web.Configuration.WebConfigurationHost::OpenConfiguration
2% | | | System.Configuration.ni.dll!System.Configuration.Internal.InternalConfigConfigurationFactory::System.Configuration.Internal.IInternalConfigConfigurationFactory.Create
2% | | | System.Configuration.ni.dll!System.Configuration.Configuration::.ctor
2% | | | => System.Configuration.ni.dll!System.Configuration.Internal.InternalConfigRoot::GetConfigRecord
2% | | | => ...System.Configuration.ni.dll!System.Configuration.BaseConfigurationRecord::Init
2% | | | => Other
3% | | |mscorlib.ni.dll!System.AppDomain::CreateDomain
3% | | | ...clr.dll!AppDomainNative::CreateDomainHelper
3% | | | Other
35% | | |clr.dll!TransparentProxyStub_CrossContext
35% | | ...clr.dll!CrossDomainChannel::MarshalAndCall_Wrapper
34% | | clr.dll!DispatchCall
34% | | ...clr.dll!CallDescrWorker
3% | | |mscorlib.ni.dll!System.AppDomain::InternalCreateInstanceWithNoSecurity
3% | | | ...mscorlib.ni.dll!System.Activator::CreateInstance
2% | | | mscorlib.ni.dll!System.Reflection.RuntimeAssembly::InternalLoad
2% | | | => ...clr.dll!AssemblySpec::LoadDomainAssembly
31% | | |System.Web.ni.dll!System.Web.Hosting.HostingEnvironment::Initialize
31% | | System.Web.ni.dll!System.Web.Hosting.HostingEnvironment::Initialize
3% | | |System.Web.ni.dll!System.Web.Configuration.HttpConfigurationSystem::EnsureInit
3% | | | Other
25% | | |System.Web.ni.dll!System.Web.HttpRuntime::HostingInit
3% | | ||System.Web.ni.dll!System.Web.HttpRuntime::GetInitConfigSections
2% | | || System.Web.ni.dll!System.Web.Configuration.RuntimeConfig::GetAppLKGConfig
2% | | || System.Web.ni.dll!System.Web.CachedPathData::GetConfigPathData
2% | | || => System.Web.ni.dll!System.Web.CachedPathData::GetConfigPathData
2% | | || => Other
19% | | ||System.Web.ni.dll!System.Web.Compilation.BuildManager::InitializeBuildManager
19% | | || System.Web.ni.dll!System.Web.Compilation.BuildManager::Initialize
5% | | || |System.Web.ni.dll!System.Web.Compilation.MultiTargetingUtil::EnsureFrameworkNamesInitialized
2% | | || ||System.Web.ni.dll!System.Web.Compilation.MultiTargetingUtil::InitializeKnownAndLatestFrameworkNames
2% | | || || Microsoft.Build.Utilities.v4.0.ni.dll!Microsoft.Build.Utilities.ToolLocationHelper::GetSupportedTargetFrameworks
2% | | || || Other
2% | | || ||Other
13% | | || |System.Web.ni.dll!System.Web.Compilation.BuildManager::CheckTopLevelFilesUpToDate
12% | | || System.Web.ni.dll!System.Web.Compilation.BuildManager::CheckTopLevelFilesUpToDate2
11% | | || System.Web.ni.dll!System.Web.Configuration.CompilationSection::get_RecompilationHash
11% | | || => System.Web.ni.dll!System.Web.Compilation.CompilationUtil::GetRecompilationHash
11% | | || => System.ni.dll!System.CodeDom.Compiler.CompilerInfo::get_IsCodeDomProviderTypeValid
11% | | || => ...clr.dll!AssemblySpec::LoadDomainAssembly
15% | |webengine4.dll!W3_MGD_APP_CONTEXT::InitializeMgdApplication
15% | ...System.Web.ni.dll!System.Web.Hosting.PipelineRuntime::InitializeApplication
15% | System.Web.ni.dll!System.Web.HttpApplicationFactory::GetSpecialApplicationInstance
15% | => System.Web.ni.dll!System.Web.HttpApplication::InitSpecial
15% | => System.Web.ni.dll!System.Web.HttpApplication::RegisterEventSubscriptionsWithIIS
12% | |System.Web.ni.dll!System.Web.HttpApplication::GetModuleCollection
12% | | ...System.Web.ni.dll!System.Web.Compilation.BuildManager::GetType
12% | | mscorlib.ni.dll!System.Type::GetType
12% | | ...clr.dll!AssemblySpec::LoadDomainAssembly
5% | | |clr.dll!LoadDomainAssemblyHelper
5% | | clr.dll!AppDomain::LoadDomainAssembly
16% |ntoskrnl.exe!KiPageFault
16% | ntoskrnl.exe!MmAccessFault
3% | |ntoskrnl.exe!KiCheckForKernelApcDelivery
3% | | ntoskrnl.exe!KiDeliverApc
3% | | ntoskrnl.exe!EtwpStackWalkApc
2% | | => ntoskrnl.exe!EtwpTraceStackWalk
2% | | => ...ntoskrnl.exe!RtlpWalkFrameChain
2% | | => ntoskrnl.exe!RtlpLookupFunctionEntryForStackWalks
12% | |ntoskrnl.exe!MiIssueHardFault
12% | ntoskrnl.exe!IoPageRead
As you can see above, there are many areas where assemblies are loaded and lots of time spent there. Virtual machines have slow disk access and this is to be expected. We can also see some page faults going on during this time period, which is also normal. In the next post, I'll cover more of this scenario.