Arduino Netduino: Collecting the sensor data and displaying it using Excel
In my previous blog:
and the blog before the first one (or former):
We were able to get the Hall Effect Switch working and to see how we could make money off this skill. It will be in this pattern many of my blog entries will be written. Checking electronic components is an important part of the industry. This is similar to testing your software.
What else can this test circuit be used for? How about a simple pendulum tester, keep in mind that if we buy the Hall Effect device in units of one, it will cost around $1.83 US including shipping, Now add a two magnets, which for six cost around $4 US at Staples, a local stationary store, plus a small index card, which has a size of 127 mm by 76 mm (3 by 5 inch) index card, or whatever is common for your country, the point is that this will form the pendulum.
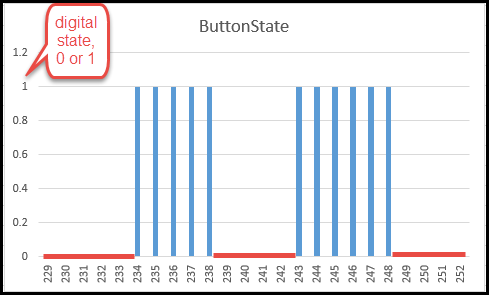
You could tape the index card to a wooden pencil sharpened on both ends for your pivot and “armature” (it isn’t a real electrical armature, but let’s call it that). By the way, the tips of the pencil are nearly zero friction bearing because of the characteristics of graphic. On the other hand, I was lazy and used the index card, cut it up a bit and use a folded point for my pivot. The goal is to get it so swing so that the Hall Effect device detects it’s presence and sends it to the serial port. Then we will need to use the serial port to display the time and output. Looking at the data, why do we see 5 ticks on one and 6 ticks on the other digital readout? This is an example of either a slowing of the pendulum, which is logical, but it could also be a sampling error. When sampling analog signals like the pendulum, one has to consider the sample period, this is explained by the Nyquist Theorem which states:
The Nyquist theorem states that a signal must be sampled at least twice as fast as the bandwidth of the signal to accurately reconstruct the waveform. (Reference: https://www.ni.com/white-paper/4653/en/)
I am just looking for data to feed my project, but in the real world you would have to consider the Nyquist Theorem every time you sample data. Really, it’s a no kidding physical requirement, you will have to get information on things like bandpass, etc. As a software designer, this is not your job, seriously, this should be done by an engineer who is skilled at making these kinds of decisions and designs, usually a consultant that gets paid good money. Get used to this, software is a service for the other sciences, with some awesome exceptions, in general software has no purpose other than to serve others. Anyway, here is the graph. Consultants are a necessary evil, cost money but have specialized knowledge.
Scroll down for the code.
And am I considering the Nyquist? No, because my precision pendulum is made up of magnetic attached to a piece of paper, so I am not making any serious measurements. This graph was made in Excel, after copying over the data and getting rid of the strings leaving just the ticks in one column and the buttonState in another column.
Using the code, basically from one of the examples in the Arduino Examples found under the File menu in the Arduino IDE, but we tested it with the switch module and the hall effect module without the pendulum so we know that it works and have a good understanding of how the code works.
//
int pushButton = 2;
int timing = 0;
//
void setup() {
// initialize serial communication at 9600 bits per second:
Serial.begin(9600);
// make the pushbutton's pin an input:
pinMode(pushButton, INPUT);
}
// the loop routine runs over and over again forever:
void loop() {
// read the input pin:
int buttonState = digitalRead(pushButton);
// print out the state of the button
Serial.print("Time Hack: ");
Serial.print(timing);
Serial.print(" the buttonState is ");
Serial.print(buttonState);
Serial.println();
timing = timing++;
delay(1); // delay in between reads for stability
}
