
Test Analytics in Azure Pipelines is now at your fingertips
You have walked the right path, adopted DevOps, setup tools for CI and CD and embraced continuous testing all the way in your software development process. Are you done?
Keeping the pipeline healthy and making it effective is KEY to your DevOps ongoing journey. Some time back we introduced Analytics in Azure Pipeline with Top failing tests report to help you do just that. It gives you near real-time visibility of continuous testing for your build and release pipeline. You can improve the efficiency of your pipeline and shorten release cycles by identifying repetitive, unreliable and high impact test issues.
Let’s look at some scenarios
- What’s the health of continuous testing in my pipelines? What is my test debt?
- How do I find tests that fail frequently?
- Is fixing test collateral helping? How do I find key owners / test files to fix?
- Are too many test failures impacting my team’s productivity?
- Tests are run in Build and Release pipeline, what’s the overall quality of the pipeline? Am I finding issues later in the pipeline leading to longer release cycle?
- and more…
Analytics in Build and release pipelines helps you do all of these and more.
Get Started
To get started for build and release, navigate to a pipeline summary page, click on the Analytics tab to view high level metrics and on the card to view the Test failure report. You will need the Analytics extension and can find more details here.
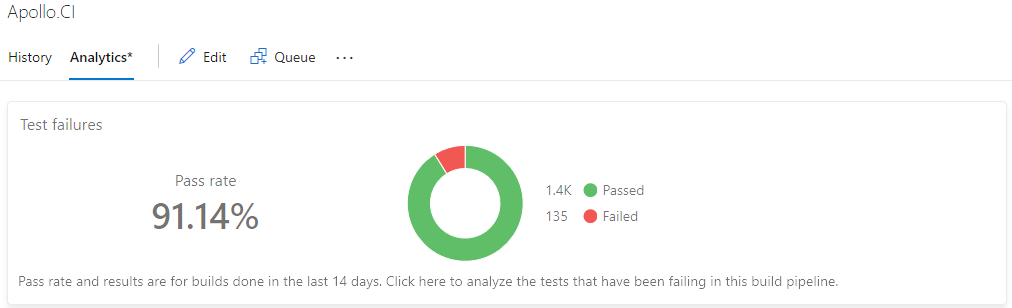
Test failure report
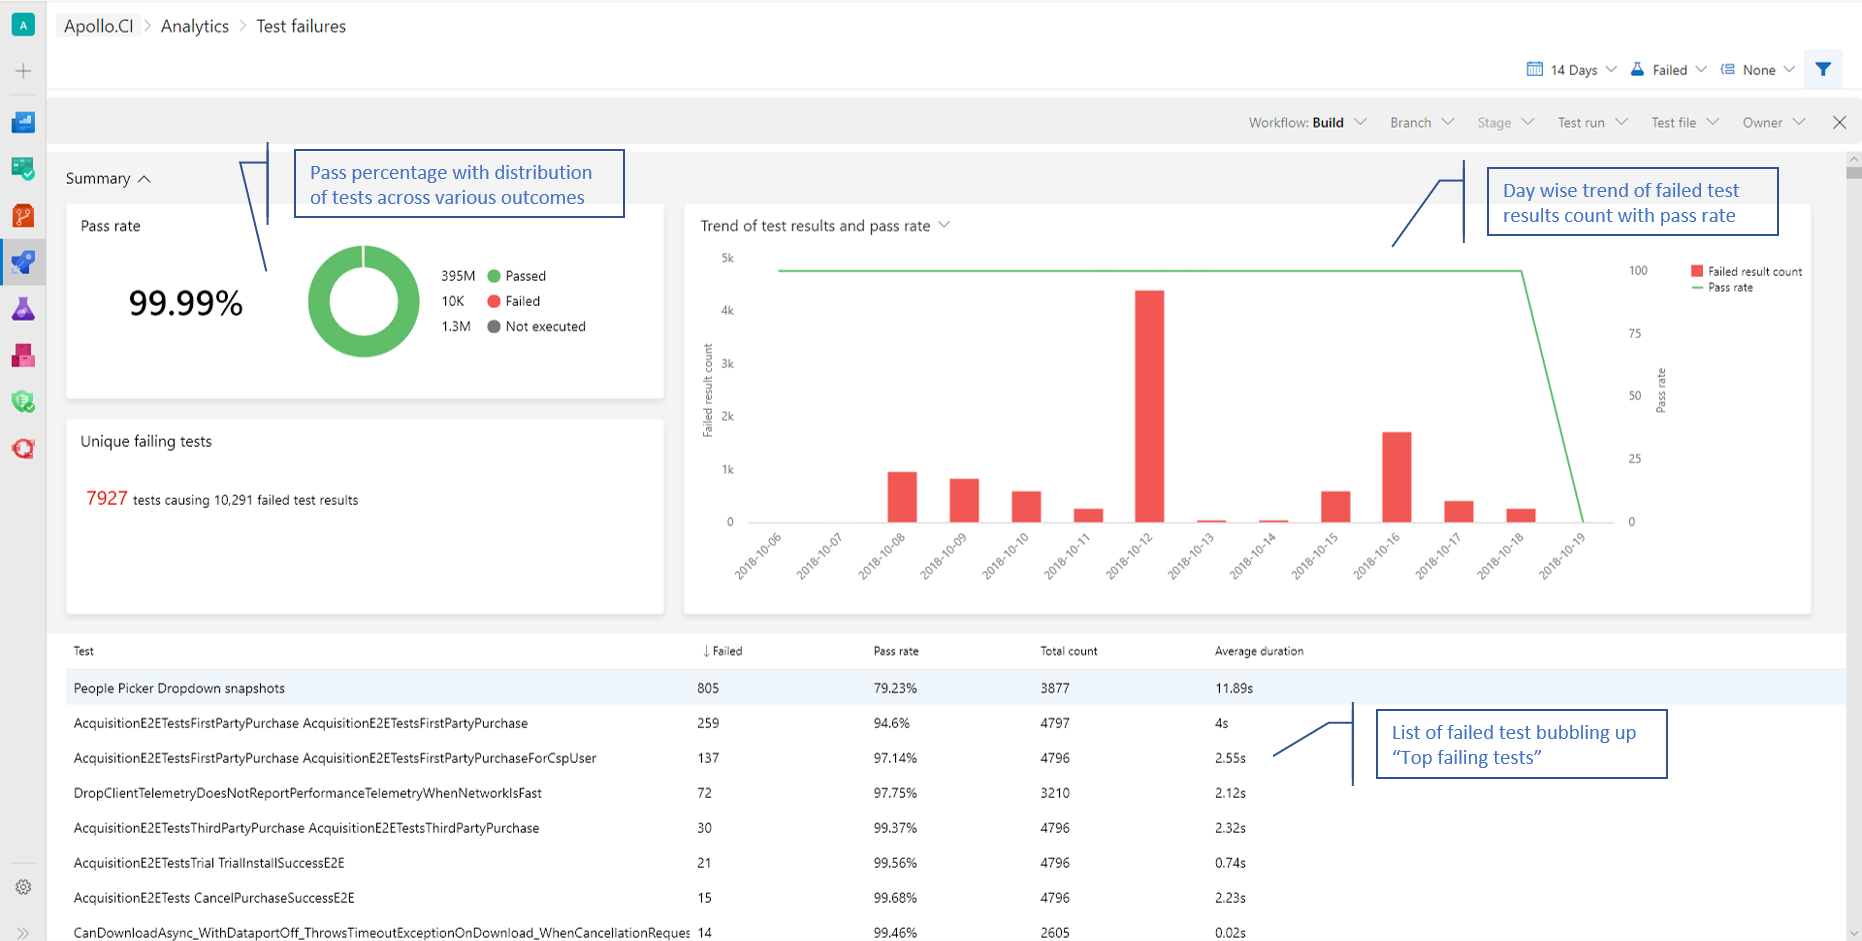
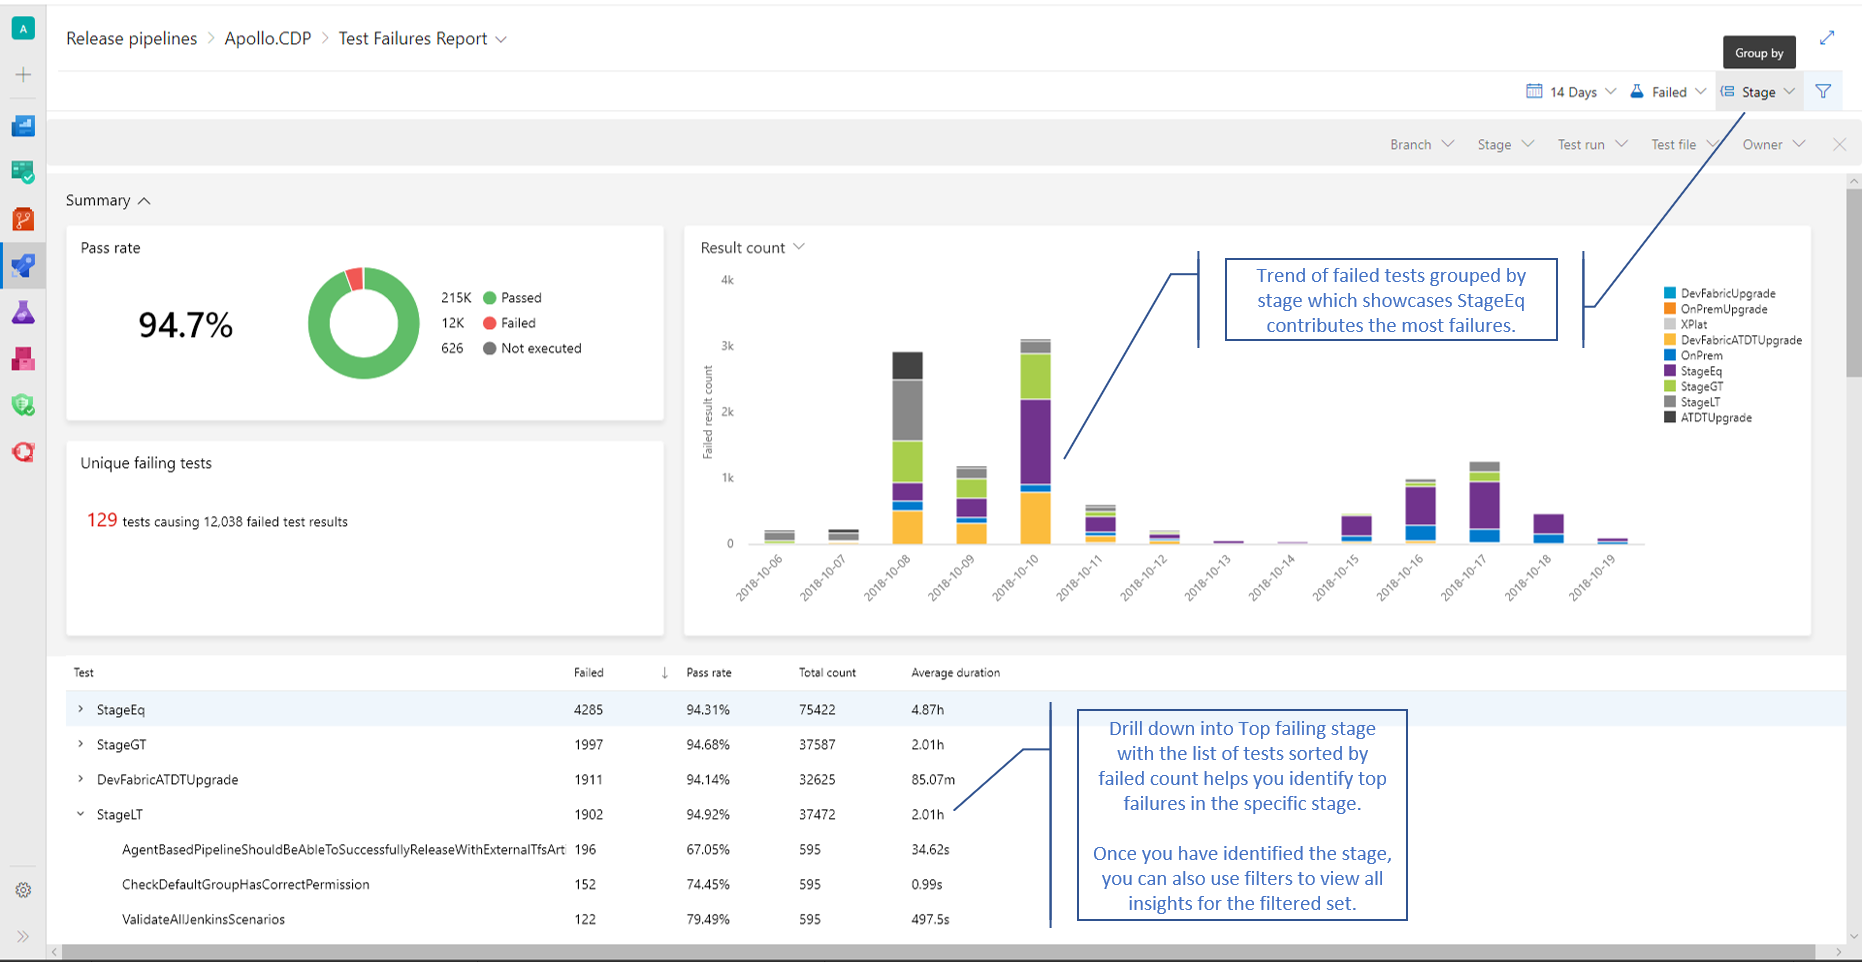
Key insights that you can draw for the selected build / release pipeline are
- Pass percentage with distribution of tests across various outcomes.
- Count of unique failing tests causing your test failures
- Trend chart of failures, average pass rate and average duration on each day.
- List of top failed tests based on the total number of failures which helps you identify problematic tests to fix to improve your pipeline.
- Ability to group and filter report data on various pivots to easily identify trends and actionable insights.
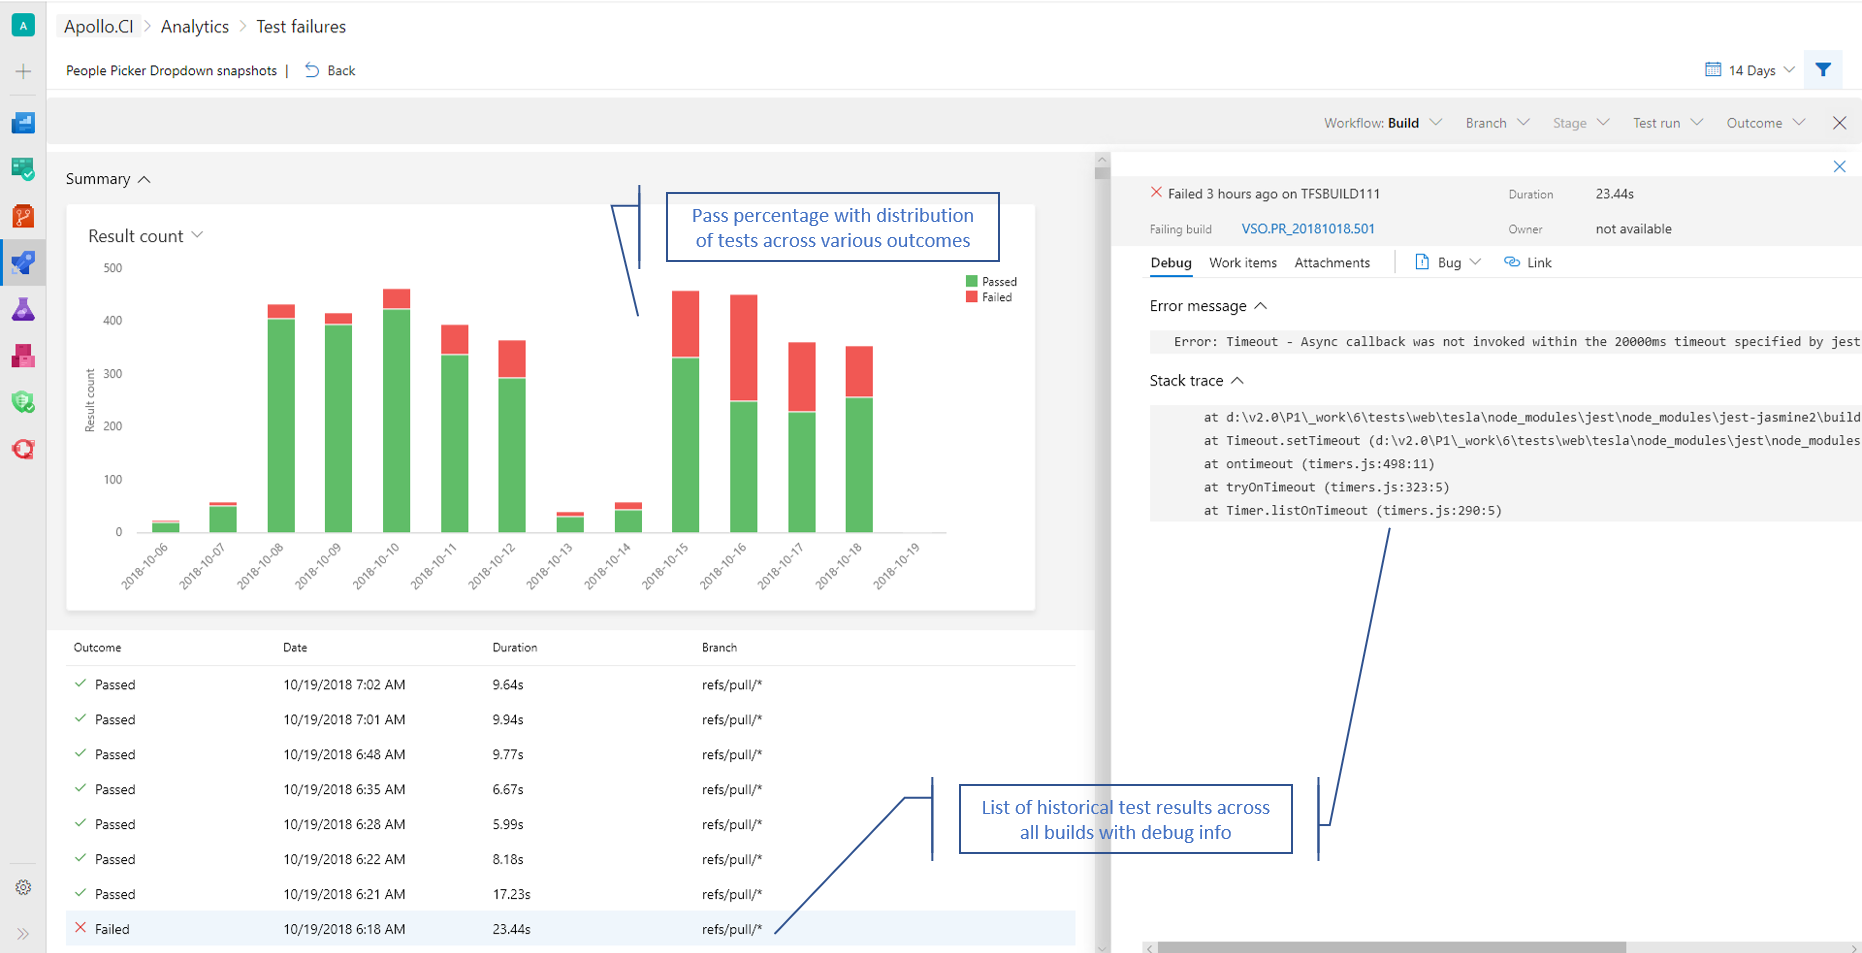
Once you have identified potential problematic test/s in the **test list **section, you can analyse the test further by browsing to that specific Test report.
Specific test report
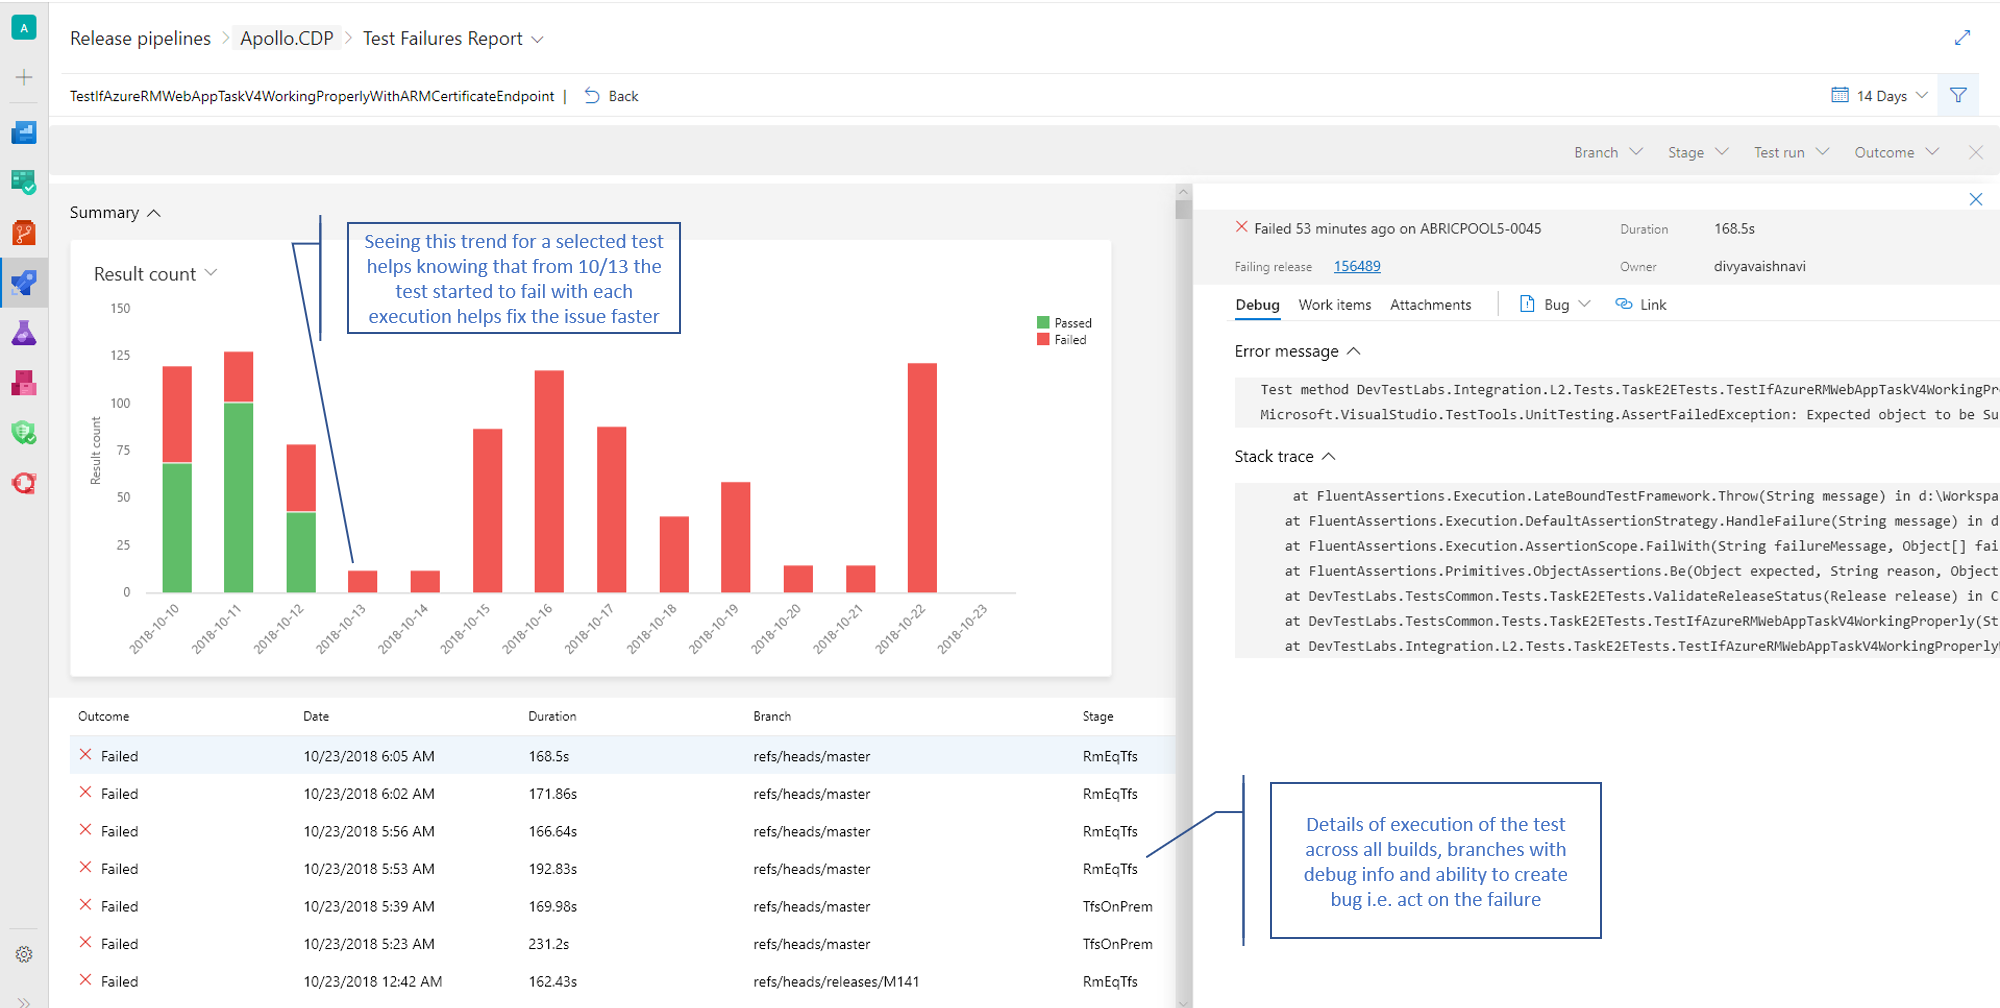
The Test report helps you with the below insights
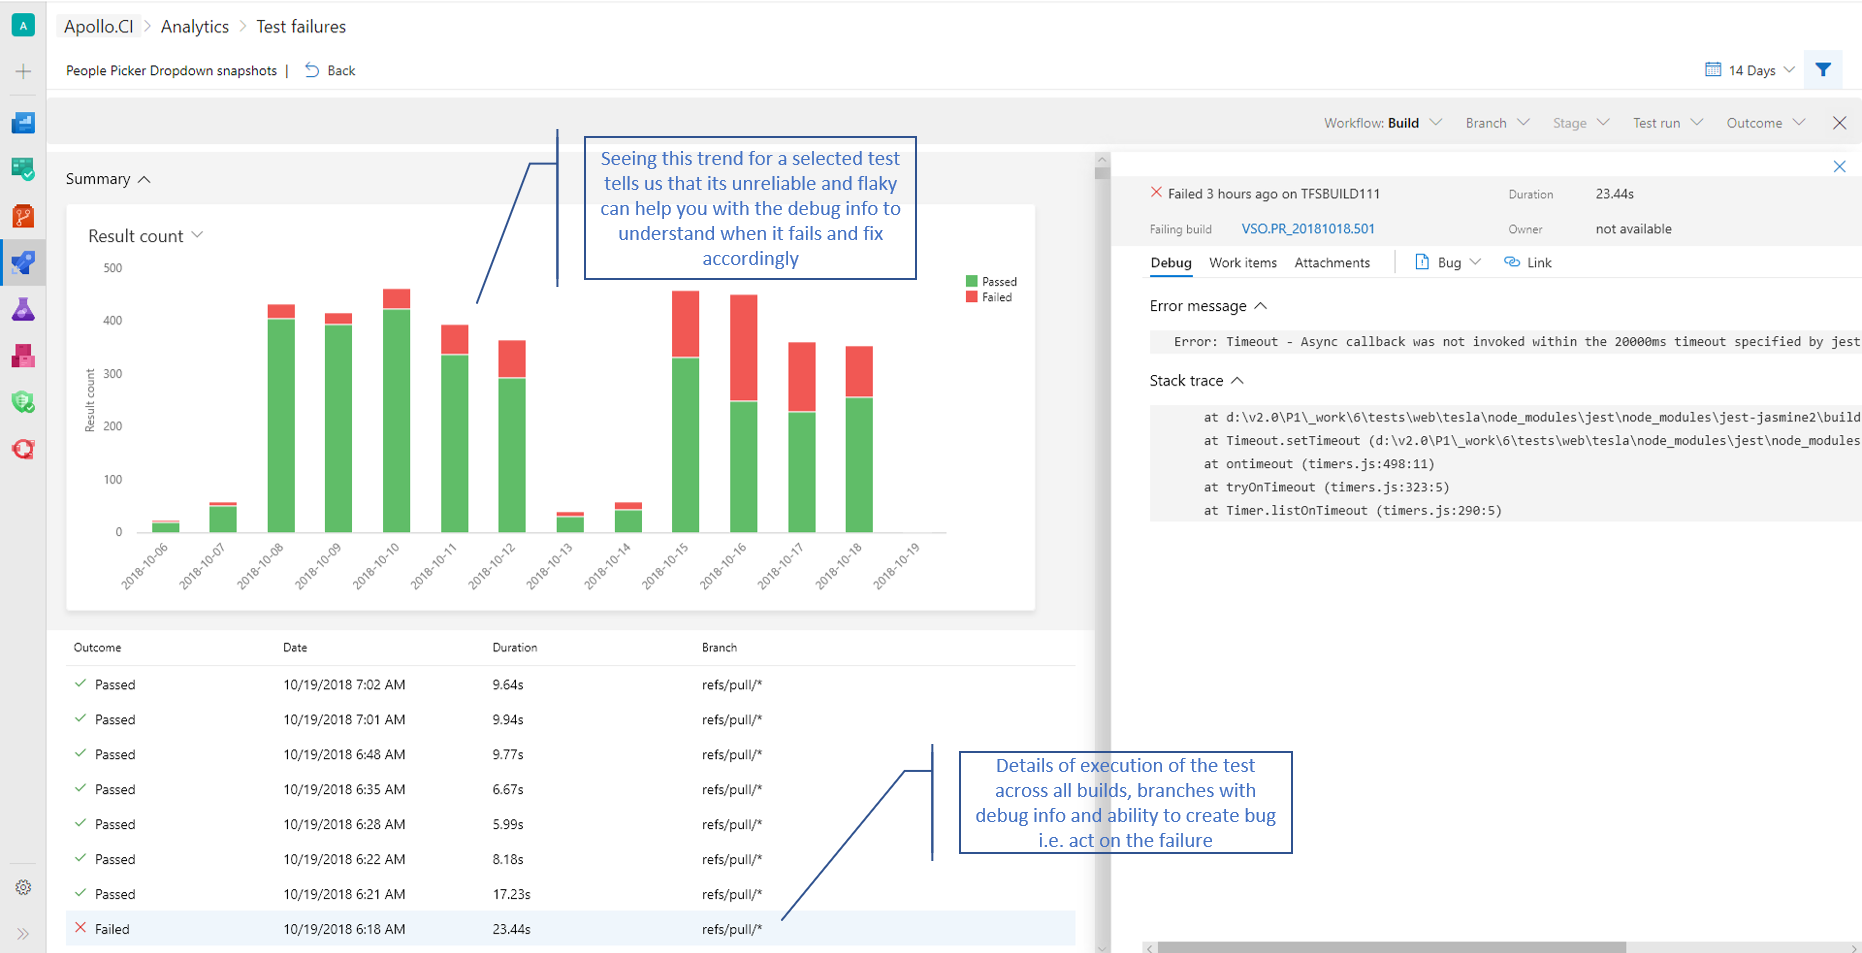
- Trend chart of test outcomes to help you identify patterns. Has the test recently started to fail or has always failed for the selected period or is flaky i.e. showcasing non-deterministic behavior
- List of all test execution instances to help you perform analysis and look at drill down view of the test execution
- Debug information with associated bugs, including link to the first failing build / release
- Filter data on specific branch, owner etc. to view trends for the selected data.
 ******
Lighting the scenarios
Now that you are familiar with the report let’s get back to how and when to use the it. Listed below are few of the key scenarios:
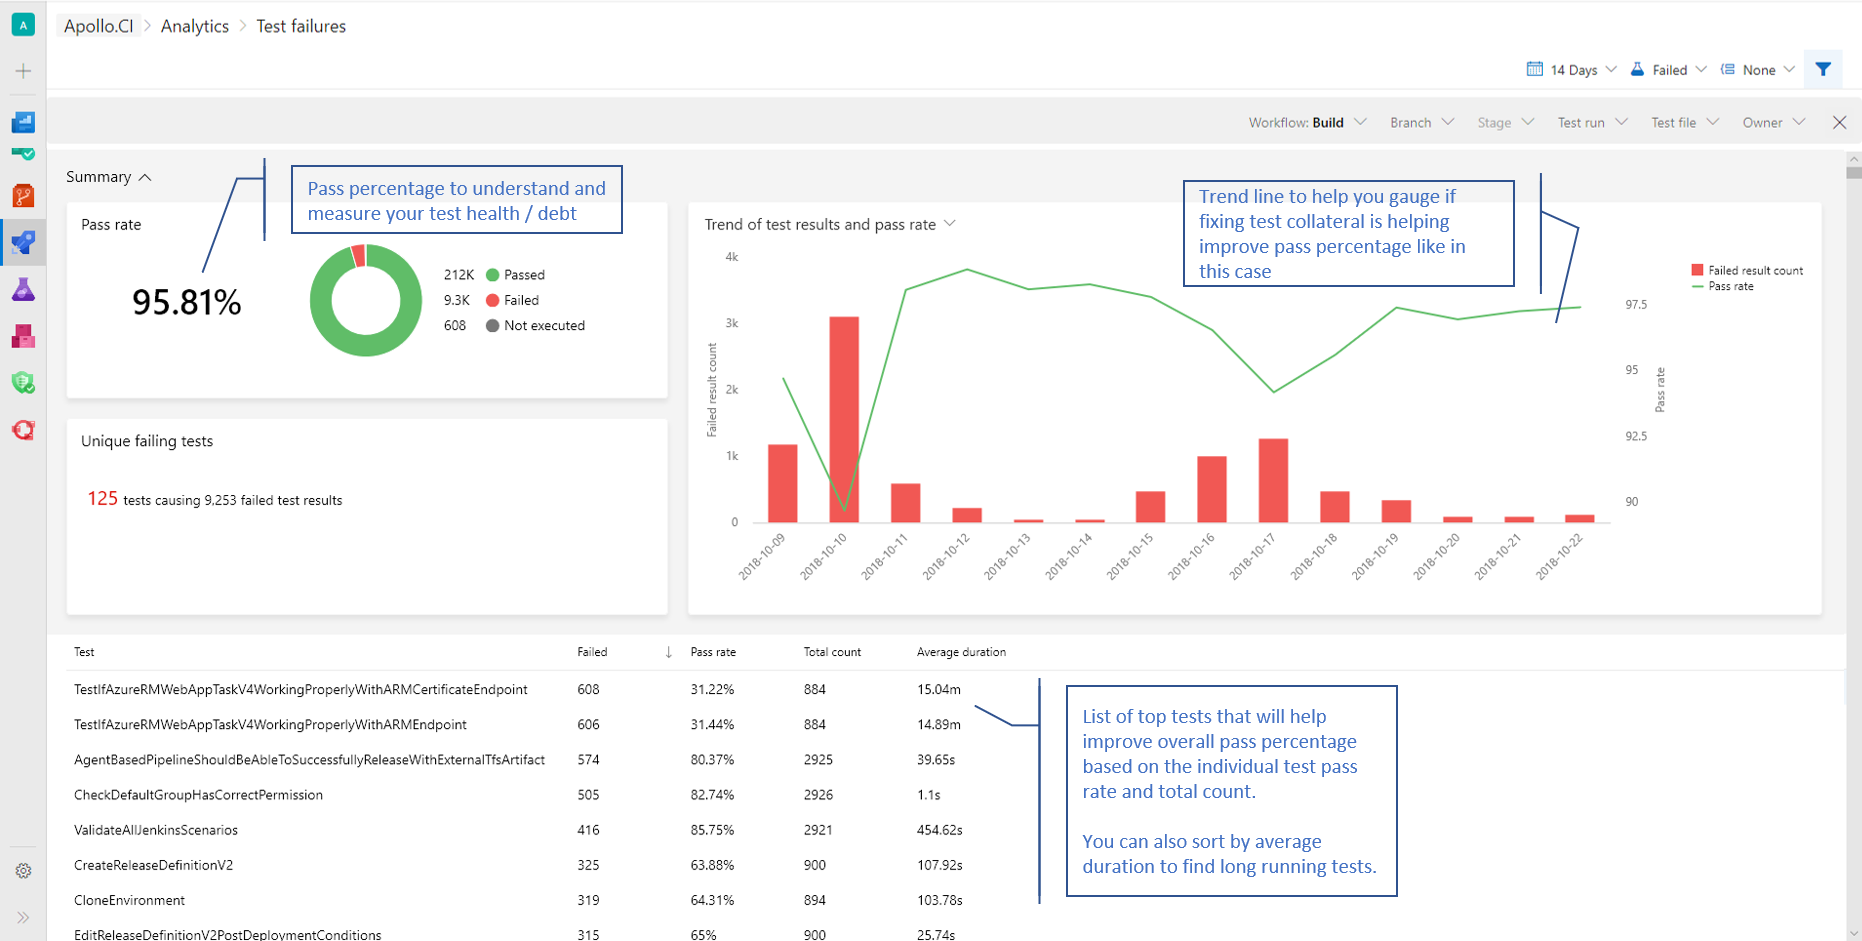
1. Health of continuous testing
For the selected build and release pipeline, pass percentage gives you an indication of the test health. Lower pass % showcases you have test debt and the trend line helps you identify if it is improving / deteriorating over time.
 ******
2. Finding trends to identify what to fix
You can group data in Test failures report by various pivots to help identify trend and key aspects to fix. Using test file helps you easily identify each test file’s contribution towards the total of test failures or grouping by owners to find POCs for top failures.
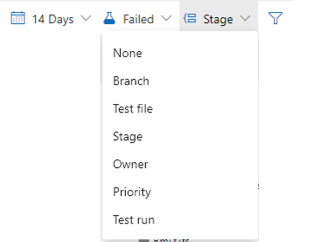
In the release report, group by stage is very powerful to help you identify which stage in the pipeline has most failures and should be fixed on priority.
3. Hidden patterns which may impact team productivity
When you are looking at test failures for a single instance of execution, it is often difficult to infer any pattern and take correct actions. Knowing the test failures occurred during a specific period or knowing a test is exhibiting flakiness (non-deterministic behavior) can help you narrow down the scope of investigation and resolve it faster. From the test report you can also file bugs with test details for closure.
Example with test flakiness.
4. Measuring test quality upstream or with “shift left”
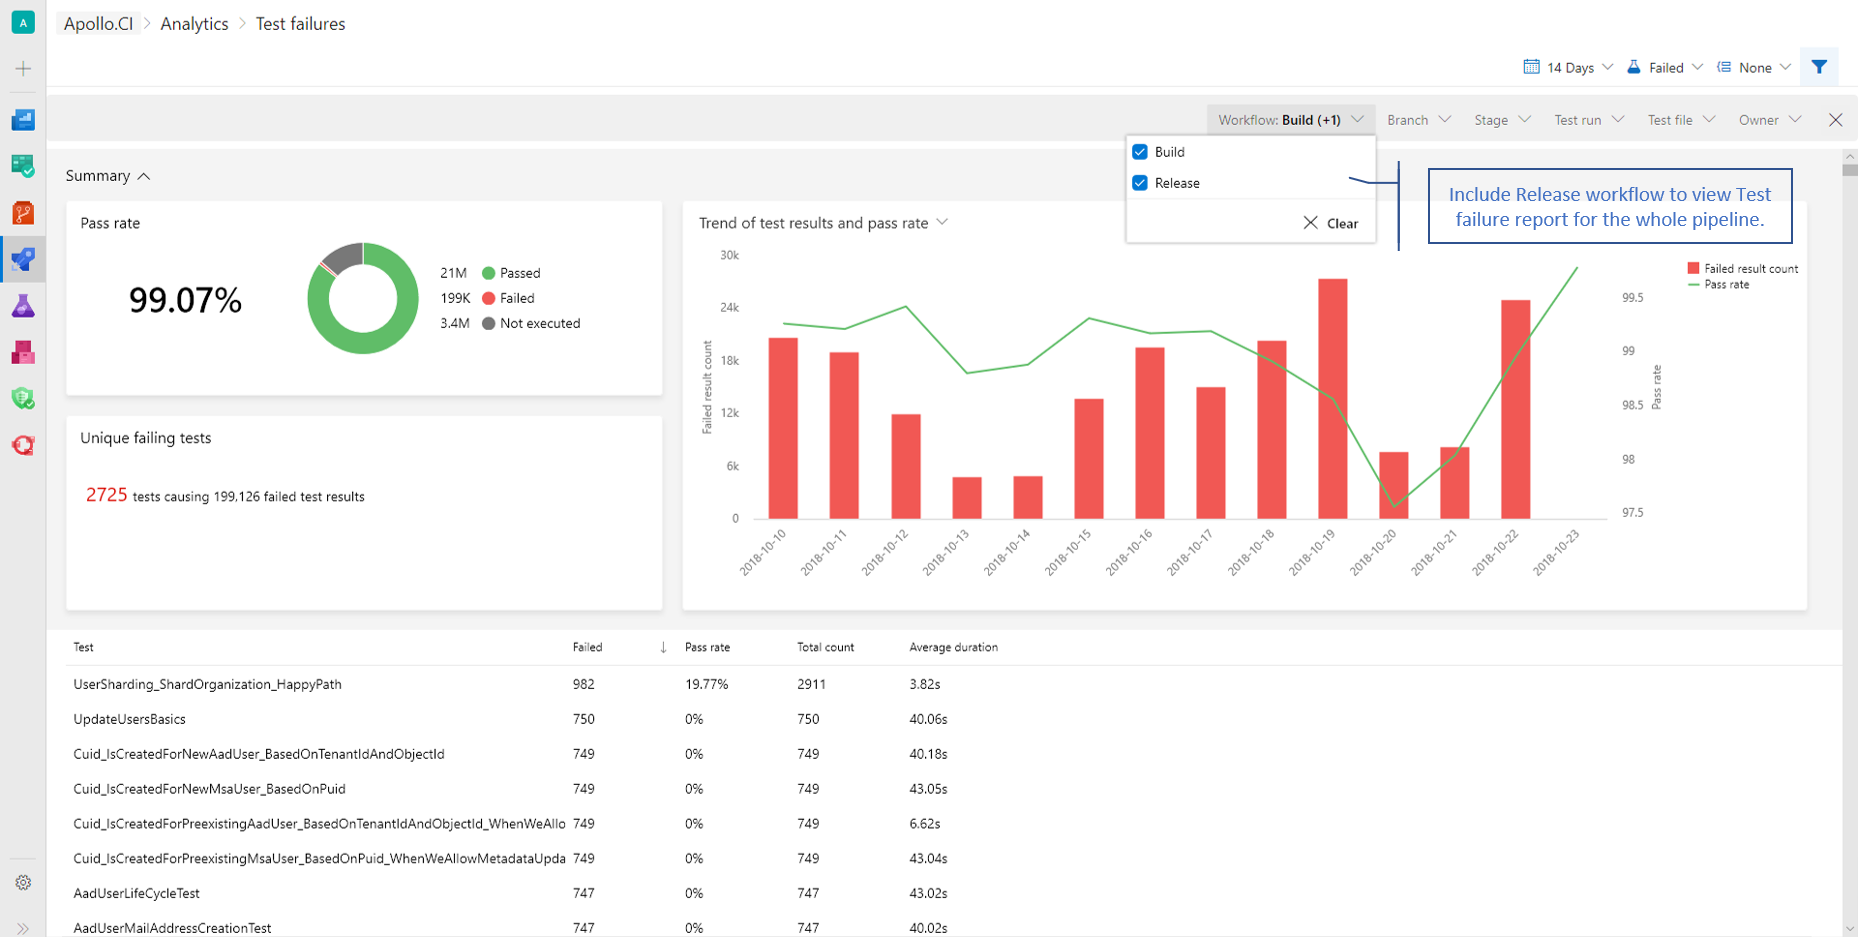
If you have adopted shift left principle then you know cost of failures increases as it progresses in the pipeline. In build pipeline you can also include Release workflow to view E2E test health of the pipeline. Identify if the test failures are occurring later in the pipeline and fix them first as ideally “test pass percentage in release should be greater test pass percentage in build”.
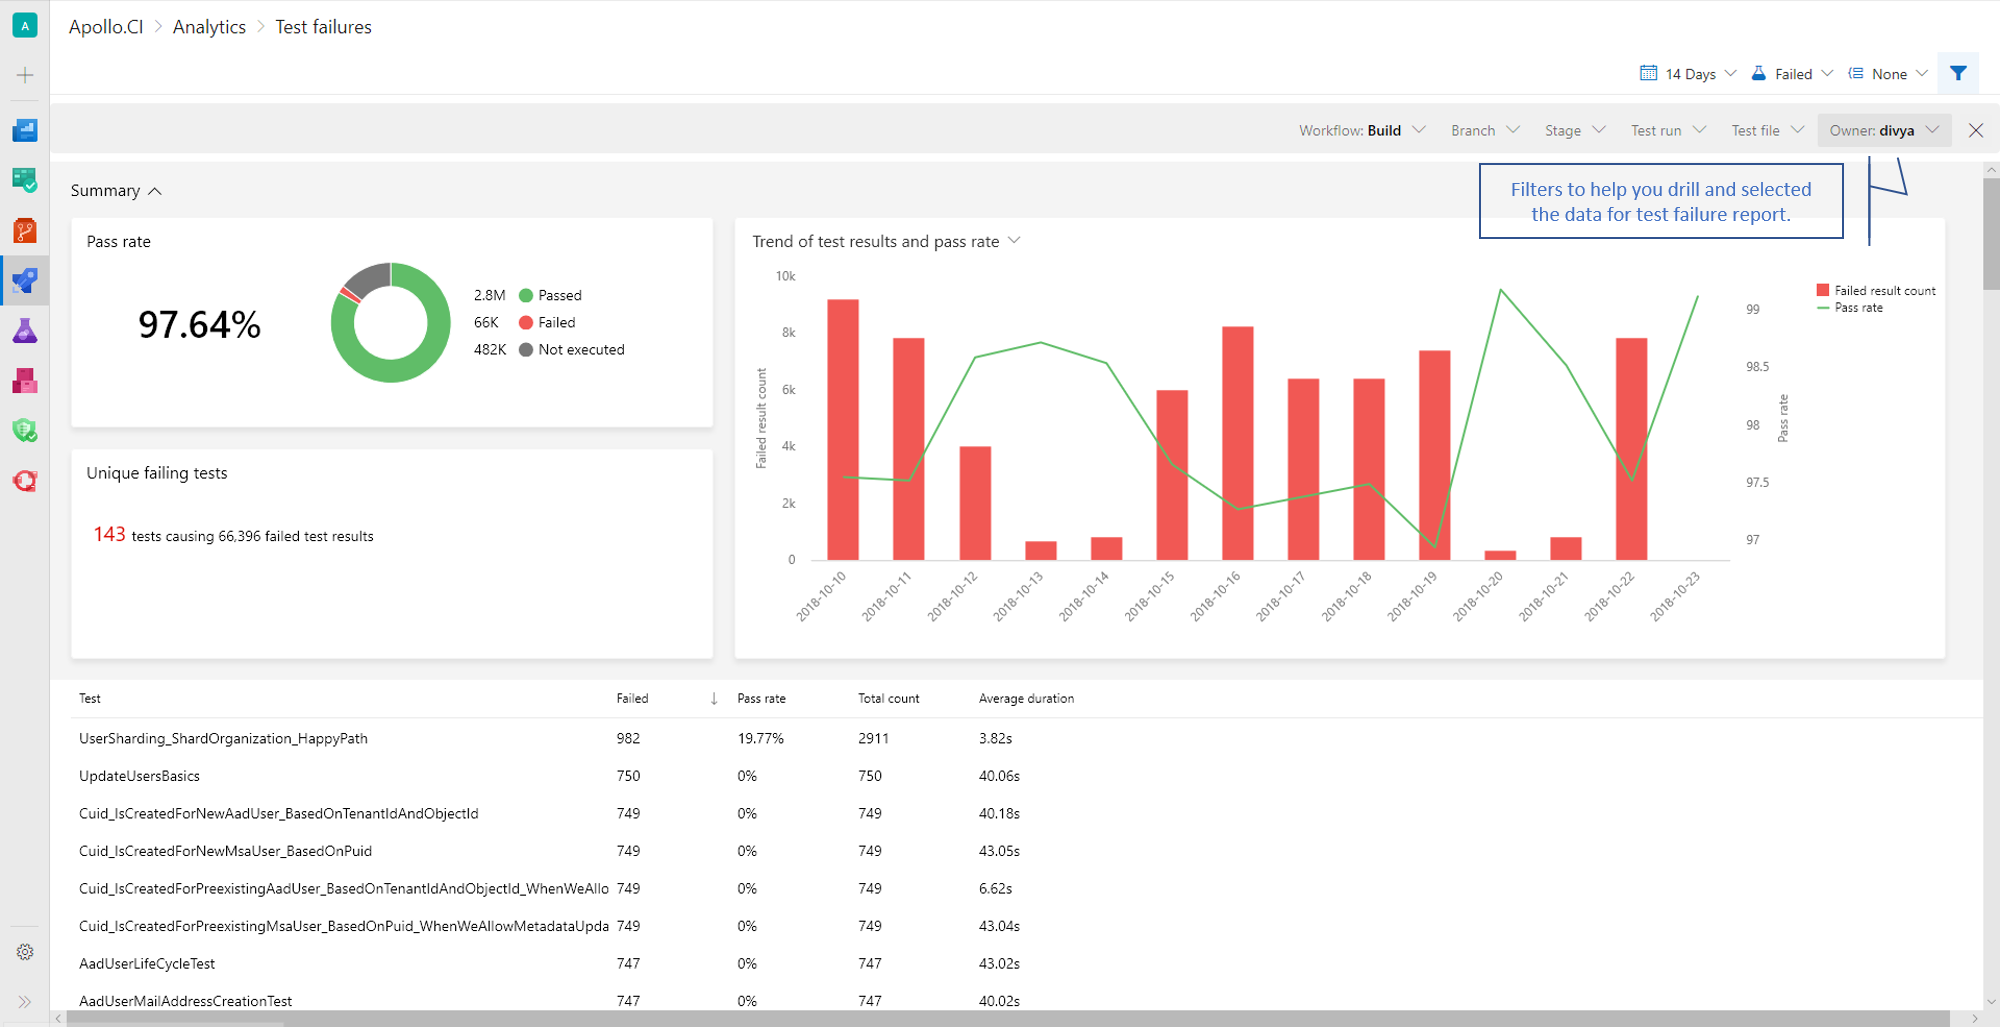
5. Test failure report for your area
You own a test file, branch or stage and want to view the test report for your area, use the filters available and all metrics will filter for the selected data. This helps you draw actionable insights on the area you own.
6. Making my tests efficient
You have a good pass rate but tests take too long to run or you want to understand long running tests to make your pipeline efficient, improve the time the developer has to wait for the PR or CI build to complete or an environment to deploy. Average duration trend and data helps you identify tests talking longer and either fix them or prioritize when they should be run.

Next Steps
This is just the start for Pipeline Analytics and we have a bunch of new features lined up. I would encourage you to use Test Analytics and share your feedback. You can refer our docs here.
Look forward to hearing from you.
 Light
Light Dark
Dark
0 comments